The future’s looking rosy for infrastructure and public sector but for everyone else, it’s shades of dismal grey to black. Experian’s Business Strategies division goes through the figures
01 / Overview
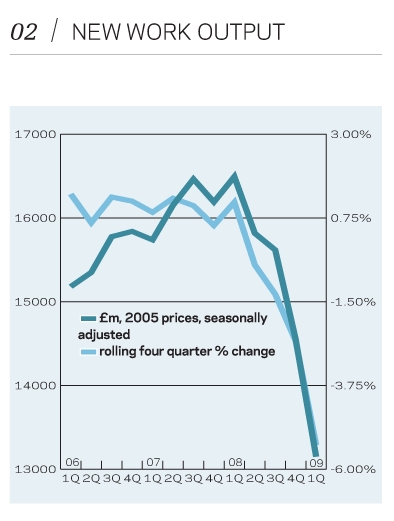
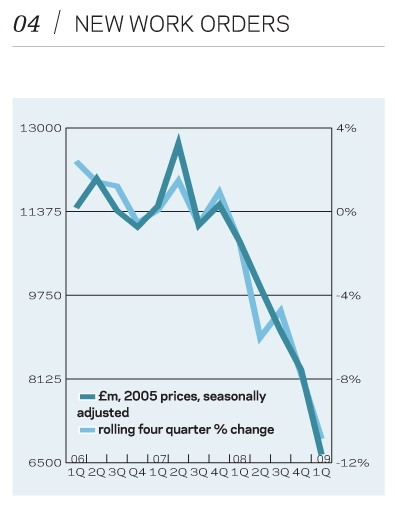
Construction output figures for the first quarter of the year were worse than anticipated; total output declined by 9% from the previous quarter and by 16.5% from a year earlier. Orders were little better, dropping 20%, quarter-on-quarter and at an annual rate of 38%.
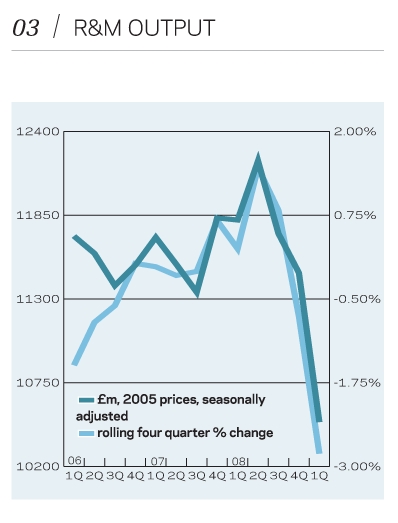
The overall figure tends to mask differences across the sectors. However, this was not so much the case this time, with the public non-residential sector the only one to see annual growth in the first quarter of the year – output in the sector rose by 7%. The infrastructure and public housing repair and maintenance (R&M) sectors both saw moderate declines in output of 5%. The industrial sector was the worst hit, with output dropping by 40%, year-on-year. Private housing sector output dropped 32%.
Industrial new orders plummeted by 62% and commercial by 55%, suggesting that the outlook for these two sectors is very bleak, at least in the short term. The same can be said for private housing, where orders halved from a year earlier, and the first quarter 2009 figure was the weakest since at least 1983, when current records began. This was in contrast to infrastructure, the sole sector to see a rise in new orders from a year earlier, experiencing a 5% increase. This is the strongest figure since the first quarter of 2002, reflecting some parts of the M25 widening contract being let.
The most recent orders and output figures make for gloomy reading, but there is increasing evidence that we may see a slowdown in rates of contraction over the coming months. However, this is unlikely to translate into a tangible improvement until 2010 at the earliest. The latest evidence shows that rates of deterioration may be easing; monthly mortgage approvals from the Bank of England reached a 12-month high of 43,201 in April after falling as low as 27,501 in November last year. The Halifax and Nationwide house price indices showed an increase in house prices, month-on-month, in May, although there were still annual double-digit declines.
It is not just the housing market showing signs of slowing deterioration – the CIPS/Markit PMI index for services rose above 50, the no-change mark, for the first time since April 2008 in May, and the first quarter of 2009 RICS commercial market survey suggested that the pace of deterioration in demand had slowed from the previous quarter.
There is some feeling that the first quarter may prove to be the worst of the year in terms of rates of declines, with weaker contractions throughout the remaining quarters of the year. Recovery is likely to be slow and the chances are there may be some steps backwards before sustained improvement is seen in either the macroeconomic environment or the construction industry.
05 / 2009-11 forecast
This chart presents sectoral forecasts for 2009 to 2011, prepared in April 2009. Construction activity is expected to decline 8% over the period, and only three sectors are forecast to see output growth. The infrastructure sector is predicted to be the strongest, with output rising in each year and by 32% in total. Overall growth is also expected in the public housing and public non-residential sectors. The worst performance will, unsurprisingly, come from the private commercial sector as no significant recovery is expected in the office market before the second half of 2010 at the earliest. The R&M sectors will be hit as firms and individuals alike cut back on all non-essential expenditure.
06 / Regional new work output
New work output in the first quarter of 2009 was down across the UK compared with a year ago, as no region or nation was immune from the recession. The strongest falls were in the East and West Midlands (EM and WM), closely followed by the West (W); all saw contractions of over 29%. The best performing regions were Greater London (GT) (-11.7%) and the South (S) (-15.4%), but even these saw double-digit falls.
07 / Regional R&M output
Two regions have actually seen an increase in output in the R&M sectors and declines across the remaining regions were generally weaker than for new work. R&M output in the first quarter of 2009 in Greater London (LON) rose by 11%; the other region with rising output was East (EA), which saw a weaker 2.8% increase. The North-east (NE) and West Midlands (WM) saw the strongest falls, of 16.2% and 15.2%, respectively.
08 / Regional new work orders
New work orders increased in just one region in the first quarter; Yorkshire and Humberside (YH) rose 6.4% compared with the same period the previous year, but this was on the back of a substantial decline throughout 2008. The strongest decline was in North-east (NE) (64.4%) followed by Kent, Surrey and Sussex (KNT) (61.7%). In contrast, in the East Midlands (EM), new work orders fell by just 8%.
Downloads
05 / 2009-11 forecast
Other, Size 0 kb06 / Regional new work output
Other, Size 0 kb07 / Regional R&M output
Other, Size 0 kb08 / Regional new work orders
Other, Size 0 kb










No comments yet