


It’s almost like they planned it this way. As the government was forced to scale back its ambitious spending plans, commercial and industrial output picked up. And, as Experian Business Strategies reports, this all adds up to a modest recovery in the first three quarters of 2006
01 Overview
In an ideal world, governments would time capital investment programmes to coincide with falling spending in the private sector. This would sustain the industry’s output at a constant level and avoid fuelling inflation.
In the early part of this decade, the public sector did just that. Whether this was its intention is open to debate, although we suspect it was more likely a happy coincidence. New Labour’s ambitious spending on health and education facilities helped push output ever upwards at a time when the commercial sector faltered and the infrastructure sector fell into recession.
In 2005, the government’s plans were interrupted (scaled back, postponed or even discontinued) as it wrangled to bring its ambitious spending targets into line with more modest revenue streams. In the absence of a full private sector recovery, the result was a mild industry recession.
However, as if on cue, commercial sector output strengthened significantly in the first three quarters of 2006 and the rate of decline in the infrastructure sector slowed. Together these factors were enough to stoke a modest recovery in total work output.
Total construction output in the first three quarters of 2006 was valued at £60.2bn, in 2000 prices, 1% higher than in the first nine months of 2005. But which sectors are likely to record the strongest outturns in 2006?
It will be highly surprising if the commercial sector fails to be at the forefront of growth. Up by 11% in the first three quarters of 2006, double-digit growth in the year as a whole is almost a given. The commercial sector continued to benefit from the recovery in the offices market and the rise in the use of PFI/PPP procurement to deliver health and education facilities. Industrial sector output was equally strong in the first three quarters of 2006, as construction activity increased in factories and warehousing.
On the whole, 2006 is unlikely to be a good year for public sector construction, with public non-residential output down 4% in the first nine months of the year. Public non-residential R&M and public residential R&M output fell by 5% and 6% respectively over the same period. Public housing is the exception. Its output was 25% higher in the first three quarters of 2006 as the Housing Corporation’s latest affordable homes programme began to yield output.
New work orders suggest output’s tentative recovery could strengthen this year. Orders were 8% higher in the first nine months of the year, as a 44% leap in commercial orders offset declines of 29% in infrastructure and 11% in public non-housing. Industrial orders climbed by 12% and public housing orders by 42%. In contrast, private housing orders slipped 6% to £6.2bn, in 2000 prices.
02 Public vs private
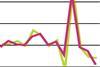
The chart clearly shows that weakness in repairs and maintenance (R&M) output continued to be a feature in the first nine months of 2006, both on the public and private sides. Public sector new work output, incorporating the public residential and public non-residential sectors, was up 2% on the first nine months of 2005. At 7%, the rise in private sector new work output was stronger. Private sector new work output includes commercial, private housing and industrial output. On the R&M side, public output was down 6% and private output down 2%.
03 Regional new work output
All new work output in the third quarter of 2006 exceeded previous valuations from the third quarter of 2005, excluding BRK and the South-west. These two regions had a year-on-year decline of 4% and 2% respectively. The greatest growth was in London, which saw an increase of 20%. The North-west was close behind with a rise of 18%. The remaining regions recorded increases of 3% to 11%.
04 Regional R&M output
As with new work output, R&M output saw London having the greatest increase with growth of 16% in 3Q06 from 3Q05. Wales and Scotland also recorded double-digit increases in output, both 14%. Five regions saw declines in R&M output; this included the North-west, which saw negative growth of –7%, the biggest fall across all regions.
05 Regional new work orders
While the South-west saw 3Q06 growth of 47% from Q305, KNT incurred a 30% drop in new orders. These vast differences show the significant fluctuations that can occur. Five regions saw increases in year-on-year orders and the remaining seven experienced declines. Yorkshire & Humber recorded strong growth of 41% and London saw a 21% increase in new work orders.
Downloads
New work output
Other, Size 0 kbR&M output
Other, Size 0 kbNew work orders
Other, Size 0 kbPublic vs private
Other, Size 0 kbRegional new work output
Other, Size 0 kbRegional R&M output
Other, Size 0 kbRegional new work orders
Other, Size 0 kb


No comments yet