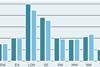
Experian Economics’ analysis of the second quarter of 2011 shows that output was slightly down on the same period last year, and the full impact of spending cuts has not even filtered through yet

01 / OVERVIEW

Construction output totalled £26.2bn (in 2005 prices) in Q2 2011. This was 1.1% higher than in the first quarter of the year, but 0.3% lower than in the corresponding period of 2010. While total new work output rose by almost 3%, quarter-on-quarter, in the three months to June, R&M output declined by 2.3%. In the first six months of this year, total output rose by 3%, year-to-year.

On a quarter-on-quarter basis, the infrastructure sector saw the strongest growth in the three months to June 2011, with output rising by almost 7% to an 18-year high of £3.3bn. This level of quarterly output was last seen at the peak of the Channel Tunnel project. Work is currently under way on a number of station upgrade projects including Crossrail-related works, and the M25 widening programme is not due to finish until next year.

The private housing sector also fared well in the second quarter of the year as output rose by 6%, quarter-on-quarter. However, conditions in the housing market remain weak with very low consumer confidence and uncertainty over the strength of the recovery dampening demand.

Public housing output rose by 3%, quarter-on-quarter, in the three months to June 2011. The final allocations under the 2008-2011 National Affordable Housing programme were made in the three months to March 2011 and there is still some work to come through from projects receiving funding under round two of the Kickstart programme, the deadline for which is June 2012. New orders for the sector fell by 31% in Q2, an indication of the sectors’ short term prospects.

The public non-residential sector saw output fall by 4% in the three months to June, declining to its lowest quarterly outturn since Q1 2010. However, there is still a long way for output in the sector to fall in light of the substantial public spending cuts that have been announced. The outturn in the first six months of the year suggests that the spending cuts are taking longer to feed through into output, so the outturn this year may be better than expected, with more of the decline coming through in 2012. Orders for the public non-residential sector fell by 30% in Q2 2011 to just under £2bn, the lowest quarterly total for over 10 years.

Total new work orders fell by 16%, quarter-on-quarter, to just £9.5bn (in 2005 prices) in Q2, the lowest level since the series began in 1964. With the exception of the industrial sector, orders fell across the board, giving some indication of the prospects for the construction sector in the shorter term. The public housing and public non-residential sectors both saw falls of about 30%.

The outlook for the second half of the year is much weaker, with the private sectors remaining fragile and the public sectors starting to turn down as spending cuts filter through to output.

02 / NEW WORK OUTPUT

new work output

03 / R&M OUTPUT

R and M output

04 / NEW WORK ORDERS

new work orders

05 / 2011-13 FORECAST

extra

The chart presents sectoral forecasts for 2011 to 2013. The public sectors - both housing and non-residential - are expected to fare the worst over the forecast period, not surprising considering the substantial funding cuts that have been announced. The industrial sector is likely to be one of the stronger performing sectors, with output expected to be 18% higher in 2013 than it was in 2010. Growth in the sector is expected to accelerate in 2013, largely predicated on the start of work on distribution and logistics facilities around ports projects such as London Gateway.

06 / REGIONAL NEW WORK OUTPUT

regional new work output

New work output rose in six of the 11 regions and devolved nations in 2Q11. The strongest increase was in London where output rose by 12%, followed by the South-east (7%) and South-west (5%). The growth in Wales (2%), East Anglia (2%) and Yorkshire and Humberside (1%) was more moderate. In contrast, falls were seen in Scotland (6%), the North-west (5%) and the West Midlands (2%) and East Midlands (1%).

07 / REGIONAL R&M OUTPUT

regional r and m output

Just three of the regions and devolved nations saw an increase in R&M in 2Q11 compared with 2Q10. Wales saw the strongest rise (29%), although East Anglia (15%) and the East Midlands (10%) also rose. R&M output fell in Yorkshire and Humberside (14%), the West Midlands (9%), the North-east (7%), the South-east (1%) and the North-west (2%).

08 / REGIONAL NEW WORK ORDERS

regional new work orders

New orders rose in just two of the regions and devolved nations in 2Q11. Yorkshire and Humberside saw an increase of 34% while new work orders in London rose by a more modest 6%. The remaining nine regions all saw double-digit declines, with the strongest falls recorded in Wales (48%) and the North-east (44%). The weakest contractions were in the West Midlands (18%) and South-east (21%).