


The emergence of the technology, media and telecoms market sector looks set to define a new office product. Here are some of the key drivers behind this change and how they might affect the cost of office delivery
01 / INTRODUCTION
The establishment of the technology, media and telecoms (TMT) sector as a core business occupier in London is driving a revolution in where firms decide to locate their offices, as the new economy establishes a path for more traditional businesses. With all firms facing the pressures of maintaining agility, managing costs and attracting and retaining quality staff, there has been a step change in interest in the City Fringe. With business confidence returning among the capital’s business sector mainstays, ongoing above-average growth in the TMT industry and constraint in supply in the prime core office markets, a new office geography is taking shape.
02 / MAPPING THE TMT SECTOR
The TMT sector is made up of different types and maturity of occupiers, ranging from technology start-ups to established multinationals. So who, what or where, exactly, constitutes the TMT market?
Tech City / Northern Fringe: Old Street, Shoreditch, Clerkenwell, Farringdon and Angel: In 2008, there were 15 media and technology companies registered in Shoreditch but by 2013, Tech City Map website (techcitymap.com) showed closer to 1,350, with take-up increasing from 20,196ft2 to 127,633ft2 over the same period. Key tenants are Mind Candy and Mother as well as 1,340 other media and tech companies.
Canary Wharf / Stratford / Hackney Wick: TMT take-up at Canary Wharf was up tenfold last year from 2007. Canary Wharf Group is targeting financial technology (“fintech”) tenants to its Level 39 Accelerator and Wood Wharf developments and hopes its big floor plates will offer expansion space out of Shoreditch for tomorrow’s Googles. Take-up has grown from 6,450ft2 in 2007 to 67,436ft2 today. Key tenants are Reuters, Ogilvy & Mather and fintech start-ups.
Mayfair / Soho / Covent Garden / Fitzrovia: With rents high, at around £90/ft2, and insufficient floor plates to host large tenants, take-up has remained relatively static, decreasing from 349,855ft2 in 2007 to 236,118ft2 today. Fuandamentally a supply-constrained market, this is further restricted by office-to-resi conversions. Key tenants are Facebook; M&C Saatchi; film, TV and ad companies.
North of Euston Road - King’s Cross / Euston: This district has been the biggest new hotspot to emerge from the recession, primarily due to King’s Cross Central and Google’s 863,000ft2 pre-let there. Take-up now sits at 960,695ft2. Key tenants: Google, Macmillan Publishing, Guardian Media Group, University of the Arts London.
South Bank: The South Bank mixes culture, affordability (rents around £45/ft2), commuter belt access into London Bridge and Waterloo and corporate-sized floorplates unlike any of its competitors. Take-up has seen modest demand, increasing from 46,788ft2 in 2007, to 49,476ft2 today, with News Corporation signing a prelet for the whole of the Shard’s little sister, the Place. Key players: Predominantly large media occupiers.
Midtown: Equidistant between the City and West End, this district is ideal for services companies. The big news here, however, is not just that Amazon is taking 210,000ft2 for a new London headquarters, it is also believed to be in talks with local landowners to secure a further 500,000ft2 of office space.
03 / IDENTIFYING THE DRIVERS FOR CHANGE
Political
In 2011, the government announced a policy package aimed at re-balancing the economy and to help make the UK the first choice for entrepreneurs and investors, which included a range of measures aimed at assisting TMT business start-ups including tax relief, deregulation and funding of about £500m to help SMEs to access loans.
In December 2012, a further investment of £50m was announced towards a project to regenerate Old Street roundabout - an area, together with its environs, already renamed “Tech City”. The project would see the development of Europe’s largest indoor civic space dedicated to start-ups and entrepreneurs, with the aim of making it the location of choice for tech and digital companies and investors.
Economic
According to a recent report by Cluttons (A New City Geography), recent letting activity in and around the City reflects a trend of greater corporate cost consciousness, driving efforts to measure and manage accommodation costs more effectively. Increasing business rates have added to costs.
The TMT sector has led the charge, with economic growth in the sector expected to accelerate over the coming years with forecasts indicating GVA expansion of 16% by 2018 (Experian). The continued expansion of the sector will place additional pressure on London’s office stock.
Sociological
Despite the economic malaise, the reality for high-growth sector businesses is a shortage of the most skilled staff. Employee expectations of a quality and productive office environment, that is highly accessible, have driven businesses in the TMT sector to look at alternative locations to secure appropriate stock at an affordable price.
These locations also need to provide the necessary ancillary infrastructure of services to appeal to staff, including restaurants, bars and shopping in order to draw the best-quality workforce. The current growth rate is unashamedly urban and predominantly London-focused, and greater demands are being placed on the office building which staff inhabit, in terms of space, quality, efficiency and to an extent the local environment as well.
Technological
The property challenge is reflected in the diversity of the TMT sector. For example, a recent BNP Paribas survey found telecoms firms are generally happy to lease traditionally corporate workspaces, while bigger, long-established media advertising companies, whose margins remain relatively tight, are more concerned with finding more efficient building spaces. The property industry is responding with audacious projects, resulting in a diverse yet complimentary physical network.
04 / EMERGING MARKET RESPONSE
With declining rents, an oversupply of space and an economy struggling to escape one of the worst recessions on record, is the new-build speculative office an endangered species?
A recent Deloitte report called UK Real Estate Predictions 2013 suggested the traditional office was no longer financially viable in many UK locations because of low rents and a construction industry unable to cut build costs any further. It suggests the only way to keep schemes viable is to cut servicing and IT specifications and cram more people into the same sized space.
In terms of a new product response, therefore, how might an emerging TMT Office begin to shape up? The following table looks at the key elemental cost drivers and compares the anticipated specification differential.
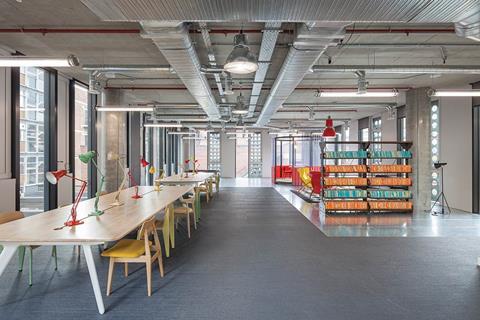
As identified, the “look and feel” of the TMT office begins to offer up a more robust or industrial feel, more akin to much of the existing stock in and around the identified emerging city-fringe market locales.
The challenge for developers, however, will be to create working environments that enable the identified TMT market players businesses to thrive and be where the talent, money and customers are and where their people can collaborate and innovate in a connected and liveable way.
Element BCO “Typical” City Office Emerging TMT Office
Shell and core
Substructure Piled foundations, secant piled wall, reinforced in-situ concrete slabs As per BCO “Typical”
Frame, upper floors, stairs and roof Structural steel with composite slab construction and inverted warm-roof construction RC in-situ concrete frame; delivering a much greater thermal mass
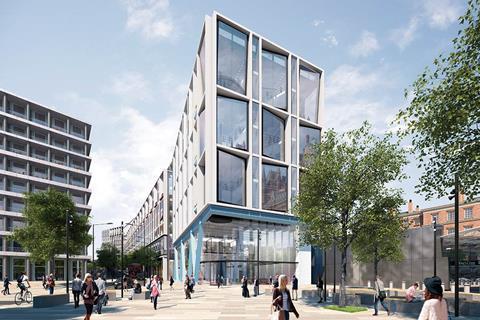
External walls, windows and doors Unitised double-glazed curtain walling with solid spandrel panels to full facade, e/o fritting and brises-soleil to help manage solar gain and thermal transmittance Unitised double-glazed curtain walling chasis, but with openable windows and intermittent solid panelling to minimise solar gain and thermal transmittance
Fixtures and fittings Natural stone to walls and floors, GRG/feature ceilings; veneer faced WC cubicles (int doors), stone vanity tops As per BCO “Typical” but with individual superloo construction (int. walls/doors)`
MEP installations Central plant, primary / secondary installations to receive 4-pipe FCU tenant fit-out Central plant, primary / secondary installations to receive passive-cooling system; fibre-optic data spine installation to facilitate tenant “plug & play” fit-out
Category A fit-out
Fixtures and fittings Raised floors, carpet and integrated suspended / feature ceilings Raised floors, carpet but with exposed concrete soffits with/without applied finish such as spray applied plaster or paint finish
MEP installations 4-pipe FCU; specialist lighting integrated with suspended ceiling installation Passive cooling system delivered either through chilled beams, chilled mat or chilled pipe installation; suspended lighting installation
Occupational density 1:10m² 1:8m²
04 / CAPITAL INCENTIVES
Fiscal incentives can now make the difference between a marginally feasible project and a comfortable investment. Most investors are now knowledgeable about the benefits these incentives can offer and look to build an allowance into their appraisal calculations.
The capital allowances available fall into several categories dependent on the nature of the building, specification and location. At the basic level are plant and machinery allowances, which fall into two categories: integral features and general plant and machinery.
Integral features include the electrical system and lighting, mechanical systems including water, heating, ventilation and air-conditioning, lifts and escalators and external solar shading. They enjoy an 8% reducing balance writing down allowance, which means the tax relief is realised over around 20 years. General plant and machinery includes all qualifying items that are not integral features. It attracts an 18% reducing balance writing down allowance, so tax relief is realised over approximately 10 years.
Together, these items can make up between 35% and 40% of the costs of good quality, air-conditioned office buildings. In addition, if the specification employs particular energy or water-efficient equipment some of the items may qualify for Enhanced Capital Allowances (ECA). ECAs attract a 100% first year allowance, and in many instances would otherwise be integral features, so get immediate tax relief on items that would otherwise take 20 years to recoup. Key items include boilers, chillers, heat pumps, efficient motors and drives, high efficiency lighting, rainwater harvesting, grey water recycling and water-efficient sanitary fittings.
When looking at TMT properties there are a number of issues that can have an impact on the value of allowances. In general, most of the capital allowances value is made up of mechanical and electrical works. Buildings of this type will often be less plant intensive, with natural ventilation and the use of the structure to assist with moderating the environmental conditions. Although certain structural items, such as external solar shading and ventilated facades, can qualify for capital allowances, other passive cooling technologies will not.
Against this, TMT buildings may use lower cost structures and can often employ other sophisticated technologies, which may maintain or increase the proportion of the building cost that qualifies for capital allowances. These can include renewable energy, or renewable heat generation such as photovoltaics, mini CHP, biomass boilers or solar thermal systems, which qualify as integral features or ECAs. In addition some of these technologies will attract feed-in tariffs or the renewable heat incentive, which both generate income for the owner. However, because recent legislation changes prevent anyone receiving both income and ECAs there will have to be a decision whether to receive immediate tax relief or long-term income.
Finally, it may be possible to locate buildings of this nature in assisted areas where buildings that have been in a period of disuse can be renovated and the area revitalised. Therefore, it could be possible to obtain 100% tax relief on all of the renovation expenditure through the Business Premises Renovation Allowance (BPRA). To qualify, the building and the works are subject to a number of rules including the location within an Assisted Area, past business use and it has to have remained unused for at least a year. Investors are very interested in the high levels of tax relief that can emanate from BPRA projects, and funding can often be readily available for schemes demonstrating a reasonable potential for success.
It is sensible to consider at the early stages of any project the scope for all types of capital allowances and income generation. When allowances are available for around 40% of the project costs this can represent a saving over time of 8% of this expenditure in tax relief. With FITs and RHI you can generate income streams that will pay back some of these costs.
05 / COST MODEL
Market overview / inflation
Prices edged up in the second quarter and the outlook going forward is for rising prices after five years of decline and stagnation. As a result, Davis Langdon’s Tender Price Index, which measures average tender price movement for competitively tendered projects in the Greater London area, rose by 0.5% to the end of the second quarter, with tender prices expected to rise by a further 1.75-2.25% over the year to Q3 2014.
Procurement
For four years, cost increases have been absorbed and contractors have restructured. After such a long period of retrenchment, the model of cost cutting and absorption is no longer sustainable and contractors now prefer to decline tendering opportunities where they see little chance of a sensible return and there is a waning appetite for single stage design-and-build tendering. Although materials cost pressures have been relatively benign of late, contractors are wary of taking on long term, fixed-price risks for items such as steel.
Construction management, with or without a guaranteed maximum price mechanism, is still present but again generally limited to those developers that can raise funding without a lump sum price and have the intent and resource capability to manage the risks. Benefits include speed, proactive management of the process and the opportunity for both client and designers to work directly with specialist contractors.
The cost model
The cost model takes the construction principles outlined under Section 4 above and applies them to the same notional base case adopted in the City of London Office Cost Model (Building, May 2011). As such, the model assumes a new build scenario arranged over 13 floors including one basement level. A gross internal floor area of 21,300m³, together with a notional net:gross ratio of 75%, gives a total net internal area of 15,975m². The wall:floor ratio is 0.40.
Costs are Q3-2013, based on a central London location and a construction management procurement route. Site organisation and management costs, fee and contingencies are included in the costs, but demolitions and site preparation, external works and services, fit-out costs beyond Category A, tenant enhancements, professional fees and VAT are excluded.
Renewables
Although not included within the model, provision for renewables should be made in the region of 5%, as an extra-over allowance against the cost of the shell and core MEP services installation. Typically, this would deliver some, but not all, of the following: solar PV, CCHP, solar hot water and borehole cooling.
Benchmark range
Dependent upon the overall scheme efficiency, in terms of design economics, specification, construction methodology and procurement route, benchmark analysis currently gives a range of £1,830-£2,640/m² GIA inclusive of Category A finish, with the previous City of London Office Cost Model sitting at £2,120/m² GIA at current day prices. By comparison the TMT Cost Model sits at £1,883/m² GIA which places it at the lower-end of benchmark range and some 12.57% lower than the City of London Model.
Cost model is attached as a pdf
Acknowledgments: The writers would like to acknowledge the following for their help in preparing this article: Benjamin Lesser, Derwent London; Andy White, Davis Langdon, an Aecom Company; Rob Butler, Davis Langdon, an Aecom Company
Downloads
TMT cost model - August 2013
PDF, Size 0 kb


No comments yet