The quarterly analysis of construction industry costs and prices shows everything going up except wages and employment
01 / key changes
- Consumer price inflation continues well above target
- Industry input and output costs are at an inflated level
- All construction cost measures are on an upward trend
- Price movements dominated by rise in steel prices in spring 2010
- Electrical cost increase are their highest since 2004
- Electrical materials cost increases are the highest since 1984
- Most wage agreements still frozen
- Construction employment 10% lower than last year
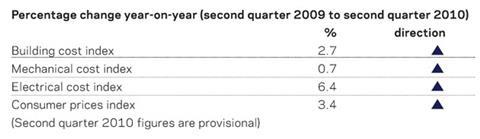
Building cost index Materials price surge results in 1.4% increase in the second quarter of this year compared with the first.
Mechanical cost index 1% increase in second quarter results in first significant rise in index for seven quarters.
Electrical cost index Continues to rise well ahead of other measures. Year on year increase highest since the fourth quarter of 2004.
Consumer prices index Increased further in the second quarter but may have peaked.

02 / price adjustment formulae for construction
Price adjustment formulae indices, compiled by the business and innovation department, are designed for the calculation of increased costs on fluctuating or variation-of-price contracts. They provide useful guidance on cost changes in trades and industry sectors and on the differential movement of work sections in Spon’s Price Books.
Over the 12 months between August 2009 and August 2010, the 60 building work categories have recorded an average rise of 5.3%, continuing the upward trend of the past three quarters.
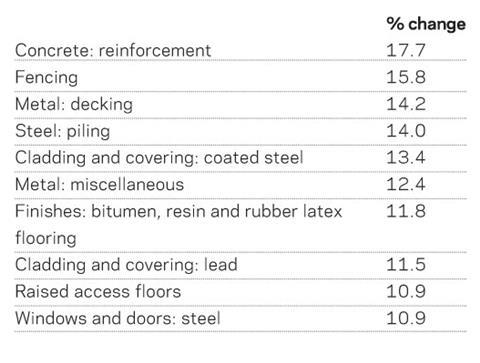
Eight out of the 10 work categories showing the highest increases over the past year reflect the rise in steel prices that occurred in the first half of 2010.
Only two categories showing a price decrease over the past 12 months are:
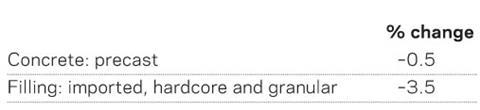
The results in these two categories reflect a drop in aggregates and cement prices over the past year.
03 / key indicators
See PDF attached.
05 / labour market statistics
- Whole economy average earnings (including bonuses) in April to June were 1.3% higher than last year
- Average earnings in construction over the same period were 0.5% higher
- Average pay in construction in the period was £554 a week
- The number of construction jobs in March 2010 (the latest available data) was 10.3% lower than a year earlier
- The number of construction job vacancies in the period May to July was down 2.7% on the year before, compared with a rise of 11.9% for all industries
- About 21,000 people were made redundant in the construction industry in April-June, bringing the total over the last year to 122,000; this compares with 298,000 in the year May 2008 to May 2009
06 / wage agreements
Building and civil engineering operatives
Building and civil engineering operatives employed under the Construction Industry Joint Council Working Rule Agreement have had their rates of pay frozen for the second successive year and are having to operate on wage rates that came into effect in June 2008. These rates are in force “until further notice”. However fare and subsistence allowances did increase from 28 June 2010.
Subsistence allowances rose 4.5% to £30.47 per night, and fare allowances rose by the same percentage; travel allowance remained unchanged from 2008.
Operatives working under the auspices of the Building and Allied Trades Joint Industrial Council, generally for smaller companies who are members of the Federation of Master Builders, will receive a 2% increase in basic rates of pay from 13 September. The new hourly rates will become:
S/NVQ3 Advanced Craft £10.62 (previously £10.41)
S/NVQ2 Intermediate Craft £9.13 (previously £8.95)
Adult General Operative £7.88 (previously £7.73)
These rates will be applicable from 13 September 2010 to 12 June 2011.
Guide to data
Davis Langdon’s cost indices track movements in the input costs of construction work in various sectors, incorporating national wage agreements and changes in materials prices as measured by the government’s index series.
They provide an underlying indication of price changes and differential movements in the work sectors, but do not reflect changes in market conditions affecting profit and overheads provisions, site wage rates, bonuses or materials’ price discounts/premiums.
In the current market, most costs recorded here are rising but prices charged to some clients are still falling. Market conditions are recorded in Davis Langdon’s quarterly market forecast (last published 23 July).
Downloads
03 Key Indicators [PDF]
Other, Size 0.23 mbWage agreement summary [PDF]
Other, Size 0.25 mb


No comments yet