In our latest analysis of construction materials prices and labour costs, Building reports on rocketing input prices and a recent drop in the cost of materials – plus why building operatives are whistling a happy tune …
Key trends
The rate of growth in cost indices has passed its peak but still exceeds 5%
Cost increases in the building sector are higher than M&E with the gap likely to widen because of higher labour cost increases
Falling steel prices bring down the cost of steel-related elements but increasing costs of non-ferrous metals drive up others
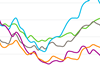
The year-on-year rate of change of all construction-related index series has now started to slow as materials price inflation rates have subsided. By contrast, the annual rate of increase recorded in the Consumer Prices Index has risen to its highest level over this five-year period.
Over the year to the second quarter 2005, out of the series, the Building Cost Index now shows the highest rate of increase at 6.3%, with the materials element rising some 5% and labour costs increasing more than 7%. This rate of increase is set to rise further as a 9.5% wage award comes into effect in the next quarter.
The graph left shows that the rise in electrical costs has now levelled off after six consecutive quarterly increases. Electrical materials prices have stabilised this year after an 11% rise in 2004.
Mechanical services costs have risen just fractionally less than building and electrical costs over the past year but with labour costs expected to rise 5% in October and materials costs still rising (up 3% in the first half of 2005), the annual rise in mechanical costs is likely to exceed that of electrical costs by the end of the year.
Price adjustment formulae for construction contracts
Price adjustment formulae indices, compiled by DTI and ONS, help calculate increased costs on fluctuating or variation-of-price contracts. They provide useful guidance on cost changes in various trades and industry sectors and on the differential movement of work sections in Spon’s Price Books.
August 2004-August 2005
Over the past year, the average increase in the 60 building work categories has been 6.1%, down from three months ago, despite the fact that a 9% rise in building labour costs entered the indices from July.
Over the year August 2004 to August 2005, two building work categories have registered falls:
Concrete: reinforcement –8.9%
Windows and doors: steel –5.1%
These index series show that the steel crisis was over by the end of 2004 and, since then, prices have been falling. However, the building work categories do not include structural steelwork, for which the DTI compiles separate index series for labour and materials. The index for structural steelwork materials for building work shows a rise of 5% over the year to July 2005 but a fall of 10% since January 2005.
The building work categories showing the largest percentage increases over the past year are:
Cladding and covering: copper +12.5
Cladding and covering: zinc +11.6
Finishes: bitumen, resin and latex flooring +11.4
Excavation and disposal +9.8
Demolitions +9.5
Concrete: insitu +9.0
Brickwork and blockwork +8.5
Insulation +8.5
Finishes: screeds +8.4
Finishes: painting and decorating +8.4
Pipes and accessories: copper +8.4
Pipes and accessories: steel +8.3
Some of these categories, such as demolitions, excavation and disposal, and painting and decorating, have had high cost growth because of their high labour content. Others, such as cladding and pipework, reflect the dramatic price increases that metals have undergone over the past two years.
The DTI’s input index for plant shows a rise of 11.4% over this period, reflecting both a high building labour content and soaring fuel costs.
Materials
As consumer prices exceed government targets, the industry is facing input prices up 13.5% on last year – a rate of increase that hasn’t been seen for 20 years …
Consumer prices exceed government target for first time
Industry input prices rising at fastest rate for 20 years
Output prices beginning to establish an upward trend
Oil prices likely to be main driver of inflation in the near term
Key indicators
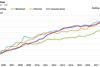
The annual percentage change measured by the Consumer Prices Index has maintained its rising trend and has now passed the government’s target figure of 2% for the first time since the target was established in December 2003. In fact inflation, as measured by CPI, is now at its highest level since the end of 1996.
The Bank of England expects the rate of inflation to have peaked by the third quarter of this year and dip back below 2% “as the impact of recent increases in oil prices moderate and pressures on capacity ease”.
Industry input prices jumped 2.3% in July after an identical rise in June, leaving the industry facing prices 13.5% higher than a year ago. The industry has not experienced a similar rate of growth since February 1985. More than half of the increase is because of crude oil prices, which have risen 57% over the year, and fuel costs, which have risen 34%.
Excluding the food, beverages, tobacco and petroleum industries, manufacturers’ input prices rose a relatively low 8.3% over the year. Input costs for manufacturers of fabricated metal products have risen 8.4% over the year, machinery and equipment 6.4%, electrical machinery and apparatus 6.4%, rubber
and plastics products 6.7% and wood and wood products 3.0%.
Over the past year, the principal commodities driving the input price rises have been:
Crude oils +57%
Gas +38%
Electricity +34%
Imported non-ferrous metals +14%
When deliberating their interest rate move at the beginning of August, the Bank of England’s Monetary Policy Committee observed that, whereas input costs had risen steeply, output price inflation had eased for two consecutive months. However, the index subsequently published for July reversed that trend, jumping 0.7% in the month. The leading component of this rise was petroleum products but prices for manufactured products excluding food, beverages, tobacco and petroleum still rose 0.6% in July, though the year-on-year rise was lower at 2.2%.
Output prices have been highest over the past year in the following sectors:
Petroleum products +14.8%
Base metals +8.0%
Fabricated metal products +6.3%
Rubber and plastic products +5.2%
Construction materials
Although on a year-on-year basis construction materials inflation figures are higher than industry output prices generally, prices of materials have started to fall over the past three months.
Materials prices for housing and non-housing work are now running at about the same level (3.5% since last December) – unlike last year, when non-housing materials rose three times as fast as housing materials prices (9.8% and 3.3% respectively). At that time, the differential was caused by the greater use of steel in commercial and industrial buildings. However, steel prices have been falling since the turn of the year in response to over-stocking and overcapacity throughout Europe now that China has become a net exporter of steel.
The increase in housing materials prices in the first half of this year is higher than during the first half of 2004. This reflects the increases that have occurred in a greater variety of building products, as manufacturing and distribution cost increases, many associated with fuel and oil costs, have been passed on to the end user (see table).
Mechanical and electrical services materials still register higher rates of increase over the past year than building materials, but the trend over the past six months is in reverse (mechanical materials up 2%, electrical less than 1%). Prices of copper products stabilised in the first six months of this year but may be on the up again as world prices have been rising again since June.
ONS figures identify the following significant materials price changes over the past 12 months since July 04:
% change July 04-July 05
Fuel oil +39.8
Gas oil and diesel +18.2
Fabricated structural steel *+15.4
Steel tubes and fittings +12.3
Copper tubes and fittings +11.6
Lighting equipment and electric lamps +11.1
Lead, zinc and tin +9.7
Cement +9.6
Insulating materials *+9.5
Ready mixed concrete +9.1
Clay bricks and tiles +8.3
Insulated wires and cables +7.4
Aluminium plates, sheets and strips +6.7
Veneer sheets: plywood etc +6.0
Coated roadstone +5.9
Central heating radiators and boilers +5.9
Paints, water-based +5.8
Metal doors and windows *+5.6
Plastic pipes +5.5
Flat glass –2.6
Kitchen furniture –8.5
Crushed rock –9.8
Concrete reinforcing bars –16.2
* increase to June 2005, June/July 2005 figures provisional
Sources: ONS and DTI
Labour
Building operatives are enjoying a further hefty pay rise, as wages go up 10% since last year – and those heating and ventilating operatives aren’t doing too badly either
Executive summary
At the beginning of this year there were 1,065,000 people employed in construction and another 700,000 self-employed – in total an increase of 25% compared with 1997. Since then, pay settlements have tended to be higher than in most other industries as a means of attracting new recruits and as a way of bringing wages in line with site rates paid to the self-employed:
- The latest three-year settlement for building operatives has lifted rates 23% in total over the three years.
- The current three-year settlement for heating and ventilating operatives has increased rates 14% in total since November 2003
Key trends
Builders are now 10% better off than last year
H&V operatives get pay rise in two weeks’ time
Eastern European labour is easing shortages – and site rates
Building and heating and ventilating operatives
Building operatives
Building operatives tied to the Building and Allied Trades Joint Industrial Council wage agreement, usually working for small and medium-sized building firms belonging to the Federation of Master Builders, received basic rate increases worth more than 10% for craft operatives and apprentices and just less than 6% for general and semi-skilled operatives from 13 June 2005. Details of the rates were given in the last Cost Update (3 June 2005).
On 27 June 2005, operatives tied to the Construction Industry Joint Council Working Rule Agreement benefited from the third and last part of a three-year agreement that lifted basic rates by a further 9.5%. Details of the rates were given in the last Cost Update (3 June 2005).
Heating and ventilating operatives
On 3 October 2005, the third and last part of a three-year wage agreement between employers and employees in the heating, ventilating, air-conditioning, piping and domestic engineering industry will come into effect. The principal change provides an increase of 5.1% in hourly wage rates for all grades plus corresponding increases in responsibility allowances, premium rates for overtime and daily travelling allowances.
The increase follows rises of 3.5% in November 2003 and 4.5% in October 2004.
For craftsmen, responsibility allowances rise from 43p to 45p per hour for one unit of responsibility (second welding skill or supervisory responsibility) and from 86p to 90p per hour for two units of responsibility (second welding skill and supervisory responsibility).
For senior craftsmen, responsibility allowance for a second welding skill is as above but for supervisory responsibility the allowance will become 90p (up from 86p) per hour. The allowance for a second welding skill and supervisory responsibility rises from £1.29 to £1.35 per hour.
Abnormal conditions money will not change and will remain at £2.99 per day, the rate since October 2002.
Daily travelling allowances will rise by the same percentage as the hourly rates of wages. Mileage rates rose from 12.5p to 20p per mile in October 2004 but there will be no change in October 2005.
Downloads
Key trends in construction prices
Other, Size 0 kb


No comments yet