


Q1 sees the UK construction industry with a more uncertain outlook but it’s not all down to the EU referendum – there are a number of complex factors at play
01 / Executive summary
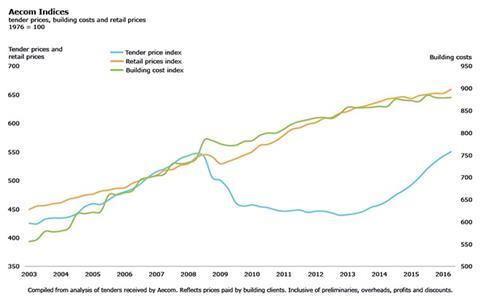
Tender price index ▲
Tender prices rose strongly again in Q1 2016, with a provisional rate of 10.3% versus the same time a year earlier. Risks to the outlook are now evenly balanced over the next 12 months and clearly to the downside through 2017.
Building cost index ▲
Building materials cost inflation trends remain benign, approximately 1% on the year at Q1 2016. Labour costs are still rising significantly on an annual basis.
Retail prices index ▲
The annual rate of change was 1.4% in Q1 2016. Low positive inflation rates are expected to continue throughout 2016.
02 / Trends and forecasts
The only certainty is uncertainty it seems – at least that’s what we are led to believe when there’s an EU referendum just around the corner. The elevated anxiety is not new though and does not stem all from the Brexit or remain debate.
Three distinct issues are at play now and for the near-term: a slower UK economy (and global economy); a moderating level of UK construction output; and EU referendum uncertainty. It is disingenuous to conflate these and suggest the referendum is the sole reason for a slower UK economy, a lower number of recent property transactions or a more uncertain outlook for the construction industry. In truth, nobody knows what will happen after 23 June. There are benefits and disbenefits to either outcome – nor are the outcomes binary.
So too for the implications on the construction and property industries. In the short-term there is higher likelihood of more volatility in some financial arenas but the medium-term impact of either result may be more benign than some of the severe outcomes suggested by both sides of the debate. The implied probability, assessed from financial instruments, of a UK default on its debt has remained low in recent months.
Foreign exchange rates, free movement of labour, foreign direct investment and construction product standards have all been mentioned as potential areas that relate to the UK construction and property industries that may be impacted after the referendum. Nonetheless, some of its direct consequences and possible outcomes are seen in exchange rates.
The pound sterling has fallen by 11% against the euro and by 5% against the US dollar since November last year. It is a moot point whether this is because of the EU referendum or whether it reflects the changing financial outlook for the UK and its currency. The direct impacts to construction make materials and equipment denominated in non-sterling currencies a comparatively higher cost. However, if sterling falls, a lower pound offers opportunities to overseas investors with non-sterling denominated funds. Does this make foreign direct investment in the UK more appealing?
Business investment has been trending down since the middle of last year. Many firms report and surveys indicate there is a hiatus on current investment spending – and uncertainty on the referendum result is cited as a factor. Whatever the result – and a remain outcome has inherent uncertainties attached to it too – there could be an immediate bounce-back in economic activity, providing a shot in the arm to the construction sector before underlying trends play out more fully. Or, no bounce-back at all and prevailing economic trends continue their path unfettered.
A / Aecom indices
Despite moderating nationwide construction industry output, capacity constraints are unmistakable. Wages and salaries, skills surveys, constructor views and sentiment all indicate an extension of the purple patch for UK construction until very recently. The only things colouring this are current discussions on the EU referendum, underlying fundamentals for the UK economy and global economic issues. These converging challenges are likely to affect UK construction in the medium-term, once near-term activity settles.
In the regions, there are some mixed messages. Many construction firms are operating at full capacity, yet others have gaps in their order books. There are good prospects for UK regions, with large projects potentially in the offing but green lights for some of these are not yet apparent.
The familiar refrain of selective approaches to procurement and tendering are still firmly at play. These factors support the supply-side part of pricing, with definite and direct links to the current tender price inflation run rate. Common themes often emerge from the supply chain and on into client/main contractor negotiations. Clear risk aversion prevails; options to recover future cost escalation are left open; there is significantly reduced or no competition for packages of works; and lengthy negotiation of terms and conditions. Any combination of these can lead to poorer outcomes for projects with an extended timeframe. Often subcontractors are attempting to secure work for late 2016 and into 2017. This means that trade capacity or even the countenancing of tendering for works beyond late 2017 is either misaligned or not possible. These factors explain why trade contractors continue to indicate full capacity in many instances, and which results in strong cost-push inflation for main contractors. All of that said, some trades in certain sectors are now indicating that they too can see gaps appearing in forward order books.
Underlying cyclical trends are emerging. As this becomes clearer over the near to medium-term, which construction sectors then step in to take up the slack? If fiscal deficit reduction is central to government policy, public sector-initiated construction expenditure may not therefore come to the rescue as it did in 2009 and 2010. Do we look to the period from 2010 to 2013 as to what may happen for construction? Shorter, smaller economic and construction cycles could be the outlook for the future.
03 / Activity indicators
A range of industry surveys and reports indicate construction sectors posting strong growth. Yet other surveys, CIPS Markit’s construction PMI for example, are now less unequivocal. Broadly though, construction surveys report stable or robust activity levels.
Early 2016 saw uncertainty appear in the market narrative though. What’s changed in the intervening period – or indeed is changing? Seasonal effects played a part in affecting output and confidence at the turn of the year. But cyclical trends and external events explain to a greater degree the softening outlook.
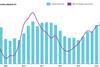
Headline UK output data published by the Office for National Statistics (ONS) suggests that a weaker rate of industry growth is at play. This trend has been evident for much of the second half of 2015. This is not to say that the ship has run aground, just the waters are looking a little choppier than those seen over the last two years. According to the ONS data, construction output (both all work and new work) across the UK broadly stood still on a monthly change basis in February. Similarly on an annual basis too. Only the private housing sector contributed positive volume change for new work when comparing February 2016 to the preceding month. In March though, output data posted a more adverse print, decreasing by -3.6% compared with February 2016, and by -4.5% on a year earlier. On a three-month basis at Q1 2016, the falls were -1.9% versus Q1 2015 and -1.1% versus Q4 2015.
Annually, the commercial sector chipped in with a small positive volume change at 0.7%, to support the private housing workload growth. Savills’ Commercial Development Activity Index recorded a headline net balance that remains positive but extends its downward overall trend. The Savills’ survey of future expectations just signalled an expansion of activity, although this degree of optimism has returned to levels last seen in 2012. Regional commercial activity was stronger than that posted in the South-east and London.
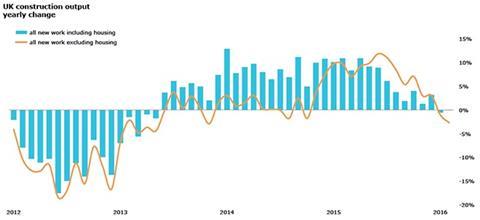
Without the housing sector, overall growth in the UK construction industry looks very different since 2012. Take away housing and all new work fell almost 3% in February 2016 versus 12 months earlier. The relative state of private and public construction sectors stand in stark contrast to each other. Private sector construction classifications contribute all new work output growth presently.
These changes to construction output are happening against a backdrop of notably slower economic growth around the globe. Recent GDP figures indicate the US posted an annualised growth rate of just 0.5% in late April. This equates to 0.125% as a quarterly growth rate – hardly an indication that this engine of global economic activity is still roaring ahead. UK GDP posted a lower quarterly growth rate at 0.4% in Q1 2016, compared to 0.6% in Q4 2015.
Eurostat’s economic sentiment indicator for the UK slipped in April and was 7% lower than the same time a year ago. Similarly, other Eurostat economic and confidence indicators for the UK, including construction, were all softer than earlier in 2016. In fact, business confidence has been weakening since the middle of 2015 according to ICAEW’s UK Business Confidence Index. Business investment is more fragile as firms halt or cut back spending.
In the face of notably revised forecasts for construction output, activity for 2016 still has momentum. The medium-term outlook is softer. How soft this is depends on the volume of projects booked as forward orders now which then turn into actual projects on the ground.
B / UK construction output
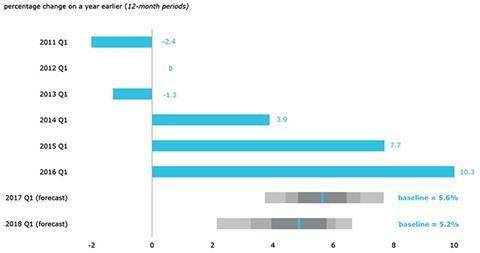
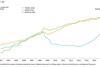
C / Aecom tender price inflation - annual run rate and forecasts
04 / Building costs and prices
Two consecutive quarters of yearly growth exceeding 10% underlines the strength of tender price inflation in UK construction. The last time this happened in Aecom’s tender price index construction of the Millennium Dome started, the two pound coin entered circulation, DVDs were released in the UK and we still changed holiday money into lira, francs and pesetas*. Aecom’s tender price index, which uses Greater London as its reference location, rose 10.3% on the year at Q1 2016. This follows on from a 10.4% annual increase posted in Q4 2015. The index level is on a par with the last peak in early 2008.
If UK construction output is moderating, why are price levels rising strongly? A lagged effect usually operates between output level adjustments and tender pricing. Moreover, a combination of industry-wide structural changes and operational choices also explain the price increases. Structural changes in the industry relate to capacity and consequent risks. The industry’s size has not returned to the number of people in the late 2000s, yet this rebound’s peak output touched 2008 volumes last year. Median levels for overheads and profit are nearer to targeted higher single digits. Preliminaries are higher too – now over 15% on a cross-sector, UK average basis. Other sectors see higher preliminary levels than this. Notable risk allowances are used because of unpredictable inflationary pressures from the supply chain. Moderating market conditions should introduce a softer approach to risk allowances this year.
Building material input costs continue their benign rate of annual change. Any small building materials price increases are offset by marginal price falls elsewhere in other materials categories. Materials prices dropped 1% between Q3 and Q4 2015 but rallied at the end of the year by posting an increase of 1% between Q4 2015 and Q1 2016.
Save for difficult to predict events arising either from the EU referendum or elsewhere and significant movements in the pound sterling, there are few reasons why construction materials costs should rise notably in the short-term. Suppliers may decide to take a chance and adjust prices, or restrict supply, so that prices might rise. But the world is awash with oil, China continues to export its excess industrial capacity and aggregate demand is faltering. Commodity prices are still struggling to pick themselves up from the floor after knock-out blows during 2015. A weaker US dollar could support commodity prices given their correlation. The predominant drivers of price inflation were, and still are, wages and constructor on-costs.
Construction trade wage rates continue to outstrip general wage inflation. There is variation across trade disciplines but average and median annual increases exceed 10% presently. Build UK reported in recent months that skilled labour and staff remain in demand. Consequent cost impacts are felt by all constructor firms. The short-term outlook is still good but there are concerns about demand for main contractor services in the medium-term. Constructor firms might begin to consider sector diversification, if they haven’t done so already.
Momentum, built up last year and carried through into 2016, will combine to support tender price inflation growth for the time being, supported by the recurring themes of contractor selectivity and capacity constraints. Aecom’s baseline forecast for tender price inflation is 5.6% from Q1 2016 to Q1 2017, and 5.2% from Q1 2017 to Q1 2018. It is important to consider these baseline forecasts in conjunction with their forecast envelope – that is, in their overall context and not as a single-point forecast in isolation. The risk skew, level of uncertainty around the forecasts and confidence intervals provide a broader context to appraise the likely path of tender price inflation.
Downside and upside risks to price forecasts are evenly balanced over the next 12 months. Considerable downside risks to pricing are expected in the second forecast period though, as uncertainties cloud the outlook for workload and pricing. Despite adjustments to overall activity levels it might not be prices that go first in signalling changes to main contractor market engagement. Adopting a softer approach to risk transfer or terms and conditions are within main contractors’ immediate control more than supply chain prices, where there is a clear desire to maximise profits while the opportunity exists.
*1998, in case you were wondering

No comments yet