


Q2 2014 saw tender prices and overall activity pick up the pace, largely due to the housing sector. While the demand for skilled trades has led to increases in day rates and wages
01/ Executive summary
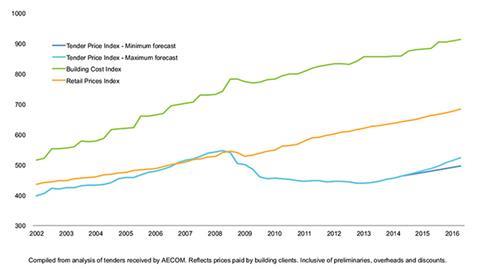
Tender price index ▲
Prices measured as an average across sectors increased by 4.8% on an annual basis in Q2 2014. The annual forecast from Q2 2014 to Q2 2015 has moved up marginally to 4.4%.
Building cost index ►
Strong demand for key materials pushed up annual rates of cost inflation. But these gains were offset by declines in other materials and commodities, resulting in the index recording no change in Q2 2014.
Retail prices index ▼
Year-on-year change remained broadly constant at 2.5% in Q2 2014. This continues a gradual trend of falling retail prices.
02/ Trends and forecasts
Could game theory explain current trends in the pricing of tenders? Aecom research in the second quarter of 2014 highlights greater convergence in contractors’ on-costs, moving in line with market sentiment. For the first time since the onset of the financial crisis, overheads and profit levels at 5% are being offered in a significant, and increasing, proportion of analysed tender returns. In recent years, attempts by the majority of tenderers to secure higher price levels have often been thwarted by a single contractor with a keen bid. Although lower overheads and profit levels do still appear, especially for preferred projects, increasing confidence suggests that overheads and profit pitched at the lower end of the typical 3-5% range will become less frequent.
Similar increases are being sought by contractors for preliminaries costs. The scramble for skilled trades has led to consequent increases in day rates and associated rhetoric. But the current demand for site supervisory and management staff is a similarly pressing issue and one that is expected to remain in the near to medium-term.
In the second quarter of 2014, tender prices rose at a marginally quicker pace than the previous quarter-on-quarter change. As a result, tender price inflation in Greater London (measured by Aecom’s index) is running at about 4.8% on an annual basis. Q1 2014 brought a hiatus in workload and pricing. The pause in the rate of tender price change was not unexpected, given the slight downward shift in industry momentum which occurred towards the end of last year.
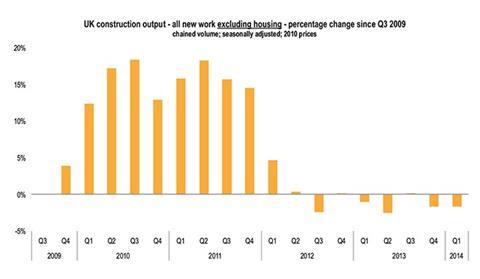
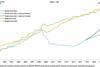
Annually, overall activity appears to be holding up and moving on. This said, getting beyond headlines reveals a clearer picture: excluding the housing sector, aggregate new work output is mostly flat (figure D). Shrinking public sector and infrastructure new work are offset by overall improvements in the commercial and industrial sectors. Does a perception gap therefore exist between heightened expectations and sentiment surveys, with that of country-wide output data?
Forecasts for annual tender price inflation have edged higher on the strength of industry momentum and capacity constraints. Tender prices across sectors are forecast to increase by 3.5-5.5% between Q2 2014 to Q2 2015. The following 12-month period from Q2 2015 to Q2 2016 is expected to see price levels rise between 3.5% and 7.5%.
Bricklaying is sometimes considered as the barometer of the industry, because it usually covers all sectors, irrespective of project size. Certainly, the current engine of construction growth activity is led by the housing sector. Materials prices responded quickly to this upturn in housebuilding. Similarly, knock-on effects to procurement and logistics are occurring through rises to already considerable lead times for brick supplies. Anecdotal evidence suggests that scale matters in being able to secure brick supplies and deliveries via a stronger bargaining position.
Brick prices are up between 10% and 20% year-on-year depending on location. Some brick producers have stopped taking orders, such is the current level of demand. Reinforcement prices, though, have dropped by more than 5% in 12 months. The benefits of declining input costs in certain materials categories are, though, being offset by other price increases. Many of these stem from strong housing sector demand.
Home-buying incentives and the continuation of record-low interest rates helped push the FTSE 350 Construction and Building Materials Index up by almost 25% in the last 12 months - its peak coinciding with Help to Buy’s effects on supply and demand. The Index has declined since, principally as a result of uncertainty around future rises to the bank rate, its impacts on mortgage affordability and the effect of Balfour Beatty’s recent woes.
Financial markets generally have lost touch with reality according to the Bank for International Settlements (BIS) - often considered as the bank of central banks. BIS, which was one of the few institutions to repeatedly draw attention to the risks materialising in the run up to the last financial crisis, recently warned of current market euphoria. It also highlighted the risks of further unsustainable asset bubbles fuelled by ultra-low monetary policy.
As output in the UK economy reaches its pre-recession levels of early 2008, passing this long-awaited benchmark will be seen as a measure of success. But when economic output is measured on a per capita basis, the metrics look very different - still 6% below its 2008 peak. Still, further signs of economic recovery are seen in actual business investment, which grew by 5% in the first quarter of 2014. The Office for National Statistics (ONS) stated that business investment contributed 0.4% of the UK’s 0.8% growth recorded in the first three months of the year. While these figures were unsurprising in themselves, it indicates a shift in the growth levers to support the country’s necessary rebalancing away from consumer expenditure and debt. The flow-through to construction activity will be closely watched as a result of higher levels of business investment.
Business confidence in the UK rose to its highest level for 22 years, with optimism growing in all regions according to a survey of 1,500 businesses carried out by Lloyds Bank. Expectations for higher orders, sales and profits in the next six months all rose, with stronger intentions to increase staff levels and capital spending.
The global picture for capital investment differs markedly to the UK’s expectations. A global survey by Standard and Poor’s of corporate capital expenditure suggests that increases in global business investment are not imminent, despite the sector’s $4.5 trillion stockpile of cash, even though last year saw a real terms decline of 1%.
In its latest workload survey, the Civil Engineering Contractors Association (CECA) stressed again the risks of a looming skills crunch. It noted that industry expansion accentuates the demands for experienced staff, and potentially undermines the sector’s ability to “fulfil its potential as a driver of economic growth”. The construction industry’s ability to deliver - whether technically complex or on a large scale - is not in question. Industry growth does, though, expose and amplify underlying or existing problems. At the same time, expansion of output introduces new issues to manage, possibly resulting from earlier decisions taken during the recession.
The short to medium-term outlook for the industry is promising. However, risks still remain, which may bring operational complications. Bank rate rises estimated for later in the year, for example, may well expose “zombie” companies - those already struggling with debt repayment or risks taken on earlier tenders. Likewise, working out tenders secured in the deeper days of the recession continues to pose problems for construction businesses.
A / AECOM INDEX SERIES (PREVIOUSLY DAVIS LANGDON)
03/ Focus: Historical trends index
What can be learned from history? Can forecasts of the future be determined by analysing past trends or historical episodes? Analysing Aecom’s historical index data reveals some striking insights. Compound annual growth rates for building costs and tender prices over a 43-year period are 7.3% and 5.6% respectively. In other words, cost increases rose at a higher rate than output prices over a long-term period.
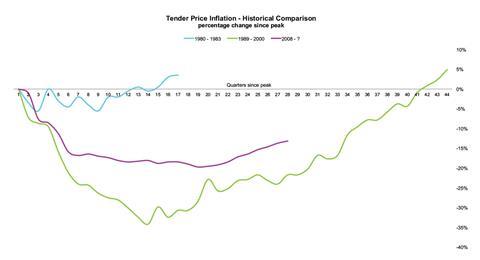
Two major price recessions evolved in this period, both in response to national and global economic downturns. The profiles of the two periods, when aligned together, show both similarities and differences. The recent price recession was not as deep as that which began in the early nineties, but the trajectory of price falls immediately after their respective peaks were broadly similar. Furthermore, the latest episode in 2008 highlights that price levels hit the start of a plateau about 18 months into the recession, yet the tender price index in the early nineties kept falling for another two years, creating a deeper trough and a 10-15% differential between the respective indexes.
Preliminaries costs were cut heavily in the most recent downturn by about 25% at the lowest point. The price recession following the 1989 crash saw unit rates for reinforced concrete work fall by more than 30%, for example. Arguably, profit levels were higher before the crash in late 1989, which pushed the index’s peak comparatively higher. Three consecutive years prior to 1989 saw tender prices increase by more than 10% on an annual basis. Will there be tender price increases of this magnitude in the future? Annual tender price increases from 2000 to 2008 did not break into double digits.
Why did this latest tender price index profile follow a different path to that of the nineties? Contractor business models have evolved, with businesses offering differing skills and capabilities based on a chosen market approach. Many constructors now carry less direct labour, plant and equipment. Fragmentation of the supply chain is much more prevalent in the market place, and could have even become more accentuated as a result of the early nineties downturn.
Improvements in information technology, leaner construction firms and changes in procurement all may provide explanations why this price recession has been less severe than its comparator in the nineties. In theory, there should be a plentiful supply of labour in the current market given EU regulations in respect of free movement of labour. Capacity constraints, theoretically, should not therefore be a barrier to meeting demand.
What will this mean for Construction 2025 and other initiatives, if pricing is central to the construction offer? Do low margins support the availability and promotion of training and development? What are the effects on an industry, which appears to bear a heavy burden after each economic downturn?
B / TENDER PRICE INFLATION - HISTORICAL COMPARISON
04/ Activity indicators
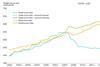
Despite a stumble in the early months of 2014, seasonally adjusted UK new work output in the early months of Q2 2014 grew by 5.3% when compared with the same period in 2013. Housing and private industrial new work led the way, with the commercial sector’s output increasing marginally in the year. The striking change in the housing sector’s fortunes is matched only by the infrastructure story in Scotland, where recorded output increased over 60% in 12 months at Q1 2014. Across the regions, variations in new work output still remind us of the varied nature of the industry’s rebound. Annual increases in regional output remain encouraging though, despite drops in Q1 output when compared to Q4 2013. The value of new orders grew by 7.6% in the year at Q1 2014. This is a pick-up in the rate of change from its preceding quarter in 2013.
Experian’s Leading Activity Index remains firmly in positive territory at 55 in July (figures over 50 indicating increasing activity), after peaking at 60 in April. The Experian orders index has spiked in each of the last three quarters, which correlates with known increases in activity. It is hoped that a slip in the Leading Activity Index does not presage a fall in the orders index later in 2014, given their historical correlation.
According to its Workload Trends Survey, the Civil Engineering Contractors Association (CECA) reported that 39% of member firms saw workload increasing in the first quarter of the year, and a higher number (58%) expecting a further increase in the next 12 months. Orders increased too in Q1 2014. Similar expansionary trends also emerged among specialist contractors. The National Specialist Contractor’s Council’s (NSCC) State of Trade Survey found that 71% of specialist contractors predict workload increases in the next 12 months.
The Federation of Master Builders’ (FMB) latest State of Trade Survey (Q2 2014) indicates a steady level of overall workload amongst its members. Its survey results highlight the housing sector continues to be the predominant motor of activity, although non-residential workload shows slight gains in the net balance survey. FMB’s latest findings underscore the pronounced divide between public sector and private sector workload. Expectations of future private sector workload are strong, but prospects for public sector workload continue to deteriorate. Three-quarters of firms are predicting increases in materials cost, although there is a slight weakening in the net balance figure. Some concern arises from the industrial sector experiencing the largest fall in workload in FMB’s survey. This does not sit with a reported rise in business investment and future expectations in this area. However, forecast industrial sector workload is still positive.
Current constructor views regarding recruitment of site trades are in broad consensus. As the housing sector’s workload begins to move through its typical construction sequence, demand for later trades is now becoming more prominent. Plumbers and plasterers are increasingly being sought, with likely upward pressure on wages in the second half of the year. Further, site supervisory staff are proving equally difficult to recruit, which compounds known difficulties in this specialism.
C / UK CONSRUCTION OUTPUT - ALL WORK % CHANGE SINCE Q3 2009

D / UK CONSTRUCTION OUTPUT - ALL NEW WORK EXCLUDING HOUSING - % CHANGE SINCE Q3 2009
05/ Building cost index
Aecom’s building cost index recorded no change in Q1 2014 when compared with the preceding quarter. On a yearly basis, the index increased by 0.4%, as energy and metals indices continued to weaken. Lower cost imports as a result of sterling’s strength, combined with slowing global commodity prices, continue to weigh on this index. Since a peak in early 2011, metals prices are 27% lower on average. This decline stems from subdued demand growth and a noticeable supply response that emanated from capacity investments made before the financial crisis.
Although China soaked up large amounts of this additional supply, prices have responded to slowing Chinese and developing economies. Indeed, the most significant movement in the headline commodities is that of iron ore. A minor rebound in April 2014 was more than offset by a further drop in price to an average of $93 per dry metric tonne in June 2014. But a fall of 32% when compared with its recent peak price in August last year - and an overall 50% drop since February 2011 - tells a clearer story. This pronounced fall correlates to slowing Chinese demand for raw materials as its economy adjusts to slower growth and its ravenous appetite for fixed capital investment wanes. However, a very recent uptick in the iron ore spot price of over 1% is likely to be on the back of China restocking this key component in steel production.
Recent increases in oil prices have resulted from geopolitical concerns, principally in the Middle East. Nevertheless, since 2011 oil prices have experienced one of the least changeable periods in recent history, averaging $104/barrel. While events in the Middle East pose upside risks to price levels, downside risks stem from weaker demand from slower developing economies and continuing energy substitution away from oil. However, the damage that high oil prices can do to global economic growth is well documented.
Joiners and bricklayers continue to experience strong demand for services, with consequent strength in wage rates. Nationally, year-on-year increases of about 10% for these trades highlight the underlying demand stemming largely from the housing sector. In general, yearly wage increases gathered pace in Q2 2014 to 4%, from just over 2% in Q1 2014. While this aggregate national increase indicates a broad trend, there are some site disciplines where pay rates are stagnant or declining - plumbers and shopfitters namely.

No comments yet