


Market conditions remain positive across the country, but boosts to regional activity put the squeeze on local supply chains and tender prices
01 / Executive summary
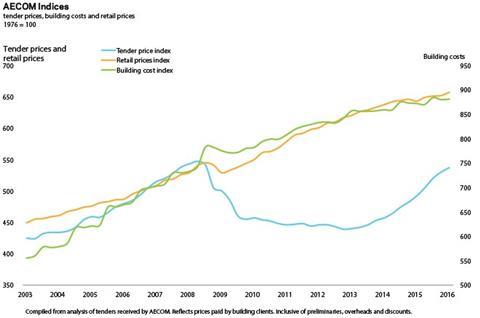
Tender price index ▲
Tender prices continued their robust yearly rates of growth, with a provisional rate of 10.0% recorded in Q4 2015. But downside risks are increasingly evident, with possible effects being felt on workload and pricing later this year.
Building cost index ▲
Building costs remain close to a well-established trend of 1% on the year at Q4 2015. Labour costs, though, continue to increase at a much better clip.
Retail prices index ▲
The annual rate of change was 1.0% in Q4 2015. Although still positive overall, low inflation is expected to continue throughout 2016.
02 / Trends and forecasts
Market conditions around the country remain positive, prospects are still good to fair over the near-term, with a low chance of immediate changes in the short-term outlook. Hotspots of regional activity have brought increased pressure on local supply chains. Inevitably, this resulted in higher rates for tender pricing as supply and demand imbalances introduce procurement pressures. These locations, along with general output levels, will therefore see sound activity levels through the first half of 2016, building out the work secured last year.
Future prospects still hold promise, however, main contractors are indicating that fewer schemes are coming through. There is still enough work though to allow order books to be filled for the coming year. Value projects are still preferred to the hard pursuit of workload volume. This has yielded noticeably higher levels of stated overheads and profit at a project level, yet this has not always translated into better margins at a corporate level. Preliminaries levels are also higher too, after acting as a distinct compression mechanism for overall price levels during the leaner years to 2013.
Trade contractors are unlikely to have yet experienced the early signs of moderating activity levels indicated by some main contractors. Many subcontractors still report full order books and strong pipelines of opportunities. Changes to headline enquiries and output will flow through to trade contractors later this year, given typical procurement processes.
Supply chain pressures still result in many and varied issues throughout tendering and pre-contract periods. Longer-than-expected tender periods are common, as is a higher incidence of non-compliant tenders – technical, pricing, time or contract-related issues are all evident. Higher spreads on received tenders are commonplace.
One area of remaining concern is the overall financial strength of firms in the construction industry. Despite significant improvements in output and sentiment, the benefits of this sustained upturn in activity may not be fully shared across the industry – at least for the balance sheets and profit reporting of construction firms.
A / AECOM indices
Two issues provide evidence for this. First, an increase in the number of UK construction firms displaying ‘significant’ financial distress rose on a yearly basis by 17% at Q4 2015 (Begbie Traynor’s red flag alert report for Q4 2015). Secondly, a common view amongst main contractors is the importance of establishing the financial solidity of their supply chain. Subcontractor failure, or its operational distress, transfers the problem to a main contractor, potentially impacting its overall project delivery. For this reason, risk allowances comprised notable cost components within commercial offers last year – and still do.
The fear of a failure in any of the supply chain linkages understandably leads to heightened awareness of subcontractor procurement. But moves towards continually seeking trade contractors with the strongest financial standing potentially gives rise to unintended consequences: further stress is added to the supply chain. Risks are therefore amplified for those trade contractors deemed to be less financially strong. In turn, default risks are higher for these firms, likely arising from cashflow issues and trading stress. Future supply chain capacity is jeopardised if more specialist trade contractors are lost to the industry.
While expanding activity can amplify problems with working capital, the same holds in the opposite direction but for different reasons. If the industry is set to moderate, with lower overall output, highly leveraged trade contractors may struggle should there be any reduction in cashflow. Those with stronger balance sheets and reserve cash will fare better against a backdrop of lower output. An ultra-low interest rate environment has merely helped ailing firms to limp on.
Although official data and anecdotal evidence indicates moderating activity, there remains sufficient work to fill order books. Looking ahead, this is based on the good prospective pipeline of commercial developments continuing, and the residential market moving onwards. Market conditions in London supported commercial development throughout 2015, with this view seemingly having now spread to other UK cities. How occupiers and developers respond to changing global economic conditions and their potentially pernicious effects will, though, determine larger changes to overall output levels. External events could well link the economic cycle and the property cycle more closely over the medium-term.
03 / Activity indicators
Construction output declined by 0.5% on a monthly basis in November 2015, and by 1.1% versus the same time 12 months earlier. The Office for National Statistics (ONS) data shows that the largest year-on-year falls were in the public sector (housing and other work), which, by relative comparison, remains in a deep freeze. Public sector workload had shown signs of life towards the back-end of 2014 and into 2015, but the sector’s output has since fallen away notably on a yearly change basis.
Infrastructure output followed a similar path over the same period. Although the infrastructure sector still posts positive annual change at over 11% in November 2015, the steepness of the declining trend since the middle of last year is significant – particularly as it had reached over 40% yearly change in April 2015.
Private sector construction classifications remain the engines of industry output. Private sector housebuilding is just still positive on a yearly metric, and private commercial work is broadly flat over the year. This is despite the Bank of England’s Agents’ Summary of Business Conditions in Q4 2015 reporting improving demand for commercial properties, particularly office space in larger UK cities.
Expected increases in office construction in London stems from demand for new space. A combination of improved business and investor sentiment – at least until the end of last year – rising rents and declining availability fuelled interest from developers. Should these underlying trends remain broadly stable then development activity will continue unchecked over the medium-term. But with external economic events looming larger on the horizon, some hesitation may edge in to investment decisions, if it hasn’t already.
Recent surveys of construction activity are also recording more uncertainty. Glenigan reported in November 2015 that the value of new projects starting on site was 4% lower than a year earlier. Nonetheless, most industry surveys and data overall remain positive across the near-term picture.
The latest Federation of Master Builders (FMB) net balance survey reported growing overall workloads for small and medium-sized construction firms in Q4 2015. However, the pace of expansion was slower than earlier quarters of 2015. Expectations for workload into 2016 are mixed amongst SMEs, as the number of recorded enquiries trended down, yet remain positive. Although a varying picture emerged across construction sectors, with respect to workloads and enquiries, most respondees expected employment and costs to rise in coming months.
Forecasts for construction work over the medium-term are still in positive territory, but some organisations offering regular forecasts of construction output have downgraded their views for coming years.
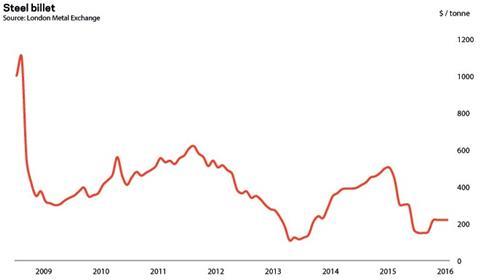
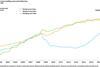
B / Steel billet
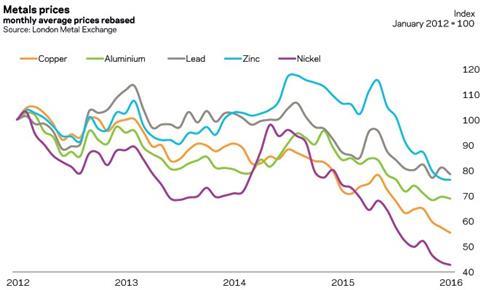
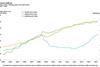
C / Metal prices
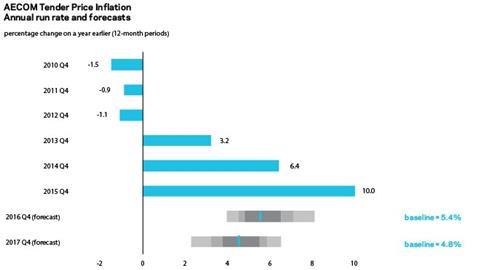
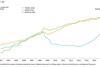
D / Aecom tender price inflation - annual run rate and forecasts
04 / Building costs and prices
Tender prices continued their robust yearly rates of growth, with high price levels still seen towards the end of 2015. Aecom’s Tender Price Index, which analysed over a quarter-of-a-billion pounds of projects by value in Q4 2015, shows that building tender price inflation in Greater London increased provisionally by 10.0% (9.96 actual) in the year ending Q4 2015.
Cost allocations for preliminaries, overheads and profit all trend higher, though these are gradual increases in the main rather than runaway changes. Prevailing market conditions mean that these on-costs do not need to be held lower and higher levels of preliminaries can be recovered more easily. The same applies to subcontractor preliminaries and profit levels, where main contractors have much less influence over these cost additions.
Possible over-pricing of risk appears to have crept in to commercial decision making. A reliance on subcontractor quotations, where higher variability or volatility is apparent, has led to risk pricing by main contractors that affords them a level of comfort or security against future supply chain cost inflation. This is understandable for any business that has to fix a price for a future period, and where market volatility prevails. But moderating market conditions might alter these views on risk allowances this year.
Aecom’s trade indices further highlight the remarkable changes in price levels experienced in the last two years. Increases exceeding 25% over 24 months have been recorded in a number of key building trades.
Input cost trends are less relentless than tender pricing. Building materials costs fell by 2% over the course of the second half of 2015, but reversed this trend slightly by posting a marginal quarter-on-quarter increase at the end of the year. More detailed analysis of building materials cost changes shows a subtle divergence emerging between internal materials and external materials. Wages, though, continue to rise solidly, up by approximately 5% on the year.
There is no sign of the deeply negative cost trends for commodities and metals changing course. Indeed, the Bloomberg Commodity Index, a broad measure of a basket of commodities, fell to its lowest level since at least 1991 in the new year. This is partly due to the strength of the US dollar, but also wider issues relating to demand, China and financial market positions. Oil is now cheaper than water and milk on a per gallon basis, after recently posting an 11-year low. But it was steel prices which made UK headlines in the latter months of 2015 – for entirely the wrong reasons.
Momentum in workload, combined with contractor selectivity and capacity constraints, will see decent tender price inflation growth for the first half of 2016, likely moderating into Q3 and Q4 2016. Downside risks are increasing, with possible effects being felt on workload and pricing later this year. Generally, the balance of risks to the industry and price levels are assessed to be on the upside over the next 12 months. The following 12-month period sees the balance of risks to the downside, as uncertainties weigh on outlook.
Aecom’s central forecasts for tender price inflation are 4.8% to 6.5% from Q4 2015 to Q4 2016, and 3.8% to 5.5% from Q4 2016 to Q4 2017. Chart D avoids the basic use of single point forecasts on their own. Because many factors influence varying levels of price inflation, especially across a fragmented industry, one size does not fit all. Instead, industry context is provided through the use of risk skew, a representation of the level of uncertainty surrounding the forecasts and confidence intervals, which are shown as the grey shaded areas to the forecasts.

No comments yet