


The economy bounced back after the immediate Brexit vote shock, with higher inflation failing to materialise. Michael Dall discusses the highlights of Barbour ABI’s monthly Economic & Construction Market Review

Economic context
The fallout from the Brexit vote continued with the latest all sector Purchasing Managers’ Index from Markit increasing to 53.2 in August, up from 47.4 in July.
This was the largest ever monthly increase in the measure and followed the largest ever fall in July immediately after the Brexit vote.
It adds to the impression that, after an initial Brexit “shock” in July, the economy recovered in August. It is still too early to draw any firm conclusions from the available data but the ultimate impact of the vote is likely to be evident in the longer term.
The labour market is still proving to be particularly robust, with the level of unemployment remaining at 4.9% in the three months to August. This is the third month in a row that this has been the rate, demonstrating that the job market has been the key success of the economy in recent times.
The fall in the value of the pound was also expected to herald in a period of higher inflation but that appears, as yet, to be unsupported by official statistics. The latest inflation figures show that the consumer prices index remained at 0.6% in August, with no change from the previous month. There was a fall in prices for hotel accommodation as well as smaller rises in alcohol and clothing prices compared with a year ago.
Other news this month on the UK economy includes:
- A survey by the Association of Graduate Recruiters showed that the number of graduate vacancies offered by top companies fell by 8% compared with 2015
- Bank of England governor Mark Carney refused to rule out the possibility of further cuts to the base rate of interest
- According to a survey by Auto Trader, one in 10 consumers plan to delay or downgrade a car purchase in the wake of the Brexit vote.
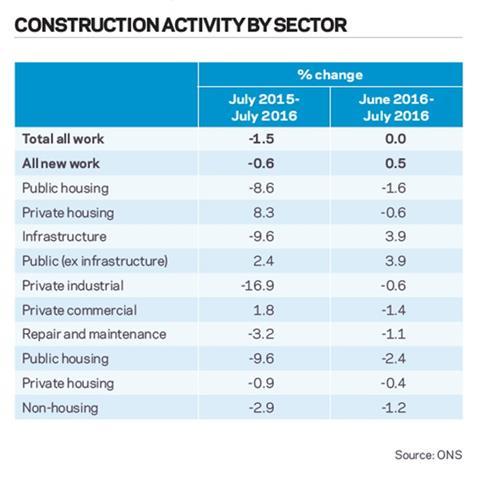
The latest figures from the Office for National Statistics indicate the construction sector in the UK showed no change between June and July 2016.
Commercial retail fell sharply but industrial factories jumped, presenting a mixed picture at a sector level
Comparing July output levels with the same period in 2015 showed a decrease of 1.5%.
There were monthly increases in infrastructure output but this was offset by declines in private housing and private commercial. Infrastructure output increased by 3.9% on June 2016 but private housing declined 0.6% and private commercial by 1.4%. Comparing the figures to the corresponding month last year showed that private housing output was 8.3% higher but infrastructure was 9.6% lower than in July 2015 (see table, below).
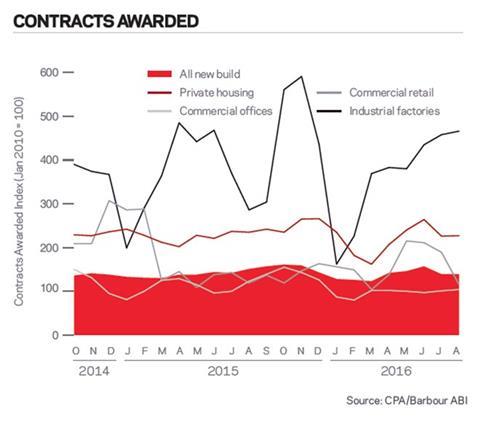
The CPA/Barbour ABI Index, which measures the level of contracts awarded using January 2010 as its base month, recorded a reading of 139 for August (see graph, below). This is no change from the previous month, which suggests that activity in the industry is flat. The readings for private housing improved slightly to a reading of 227, up from 226 the previous month. Commercial retail fell sharply from 189 to 115 but industrial factories jumped from 458 to 466 presenting a mixed picture at a sector level.
Construction sector
According to Barbour ABI data on all contract activity, August witnessed a drop in construction levels, with the value of new contracts awarded at £5.5bn, based on a three month rolling average. This is a 5.1% decrease from July and is 13.4% lower than the value recorded in August 2015. The number of construction projects within the UK in August decreased by 5.2% on July, and were 5.4% lower than August 2015.
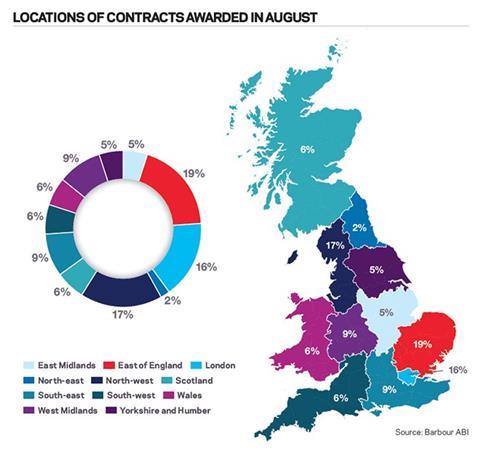
Projects by region
The majority of the contracts awarded in August by value were in the East of England, which accounted for 19% of the UK total. This was followed by the North-west and London, with 17% and 16% of contract award values respectively (see pie chart and map, below).
The main reason for the East of England’s figures this month was the award to construct the Galloper offshore wind farm in Suffolk, which has a £750m construction value.
The largest contract by value in the North-west was the expansion of terminal 2 at Manchester Airport, which is worth £450m and was awarded to Laing O’Rourke.
In London, a major residential project was awarded in August, which accounts for the largest proportion of contract value in the month. The development at Greenwich Peninsula is set to deliver 464 apartments at a value of £150m and was awarded to Mace.
Types of project
Infrastructure had the highest proportion of contracts awarded by value in August, with 33% of the total.
The two aforementioned infrastructure contracts – the Galloper offshore wind farm and the expansion of terminal 2 at Manchester Airport – are the main reasons for the strong showing for infrastructure in August.
Construction performance by sector
Spotlight on hotel, leisure and sport
The hotel, leisure and sport sector showed a large rise in contract value on both last month and August 2015.
Contract award levels were £406m in August based on a three month rolling average, 15.9% higher than in July and 49.7% higher than in August 2015. In the three months to August, the value of contracts was £1.1bn, 2% higher than in the previous three months and 26.2% more than in the same period in 2015.
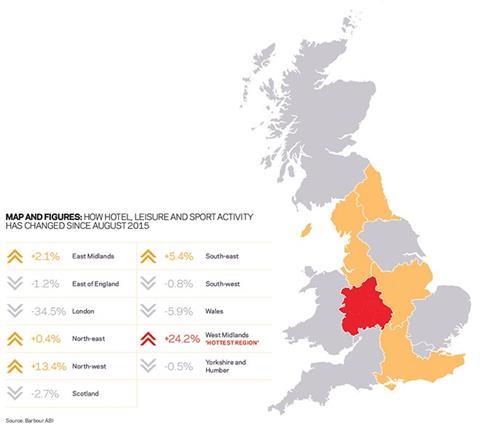
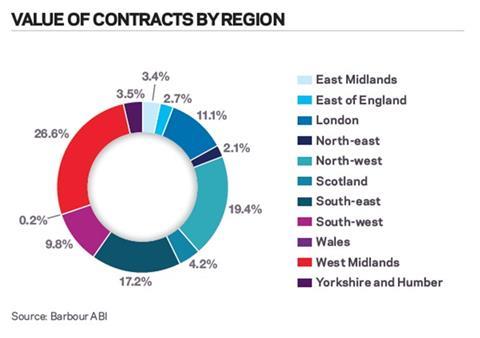
Projects by region
The West Midlands was the main location for contracts in August accounting for 26.6% of the value awarded, 24.2% higher than in July 2015 (see below and pie chart, below). The largest contract was the Regal Tower hotel in Birmingham, valued at £125m. The North-west had the next highest share of value at 19.4%, an increase of 13.4% on the previous year. The largest contract was the Hampton by Hilton hotel in Manchester, awarded to Create Construction with a value of £30m.
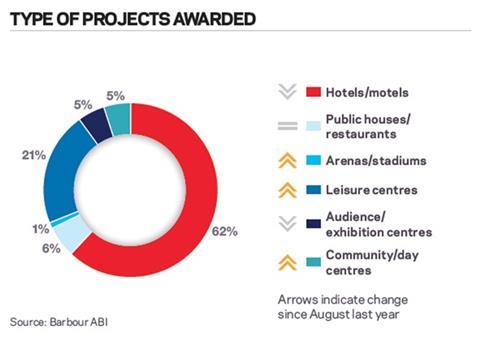
Type of projects
Hotels/motels accounted for 62% of contract value awarded in August, a fall of 7% from its share in the corresponding month in 2015 but still a sign of a strong market. Leisure centres accounted for 21% of value, a 6% increase on August 2015 (see pie chart, below).

Click here for the full Economic & Construction Market Review >>
Downloads
Economic Construction Market Review – Septermber 2016
PDF, Size 0 kb


No comments yet