The construction activity index strengthened slightly after falling into negative territory last month, but the order index worsened for the second successive month in a row
01 / State of play
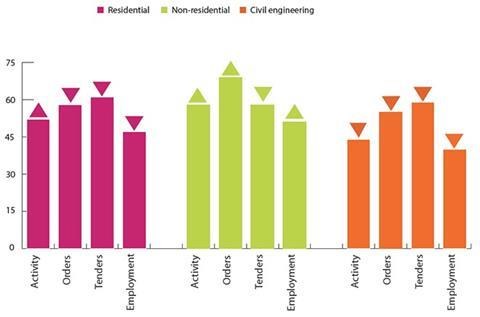
The construction activity index strengthened to 51 points in September, after falling into negative territory in August. The repair and maintenance (R&M) activity index (52) also moved above the no change mark, improving by six points. The residential sector increased by a single point in October to 52. In contrast, civil engineering fell six points to 44, thereby re-entering negative territory for the fourth time in the last twelve months. Meanwhile, the non-residential sector increased substantially to reach 58.
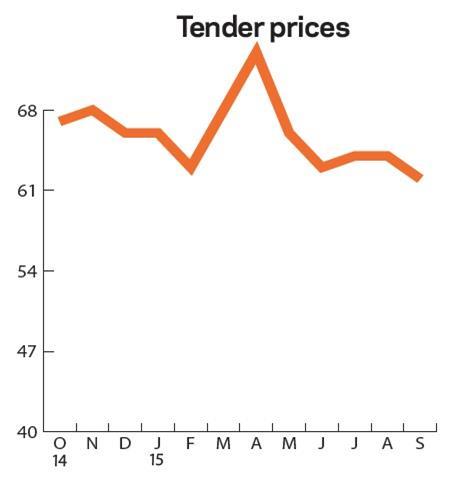
The orders index worsened for the second successive month with a five point monthly decline in September to 61. It has remained over 50 since March 2013. Meanwhile, tender enquires were flat at 59.
Opinions in September within the industry regarding activity constraints have considerably improved since a year ago, with 38% of respondents reporting no constraints, up 12 percentage points. Concerns stemming from insufficient demand remain the most significant issue among our panel, with 32% of respondents citing this as a problem, up two percentage points on a monthly basis. Financial constraints experienced a dip in September from 11% to 8%.
Labour shortages (10%) were less of an issue last month, down on both a monthly and annual basis. Those weary of material/equipment shortages ticked up to 3% of respondents. There were no reported issues regarding the weather in September.
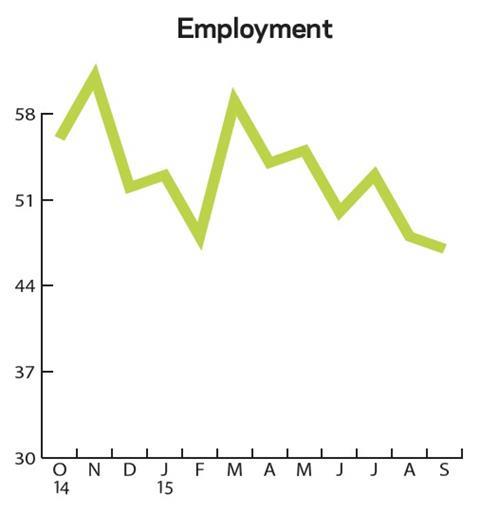
The employment prospects index (47) fell further into negative territory in September. This has resulted in the three month moving average falling below the no change mark to 49 points.
02 / Leading construction activity indicator
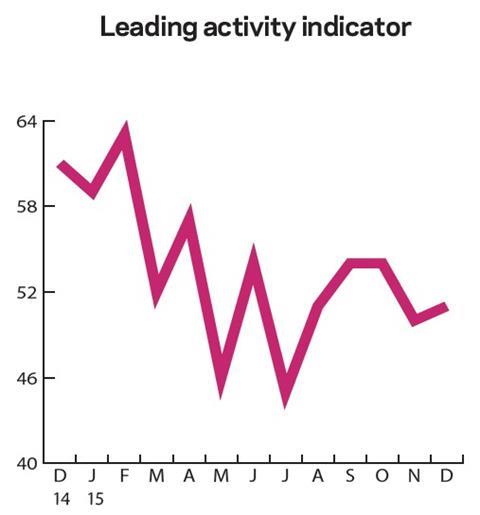
In September the CFR’s Leading Construction Activity Indicator ticked up by six points on a monthly basis to 51, returning to a value above the no change mark. The indicator uses a base level of 50: an index value above that level suggests an increase in activity, while one below it highlights a decrease.
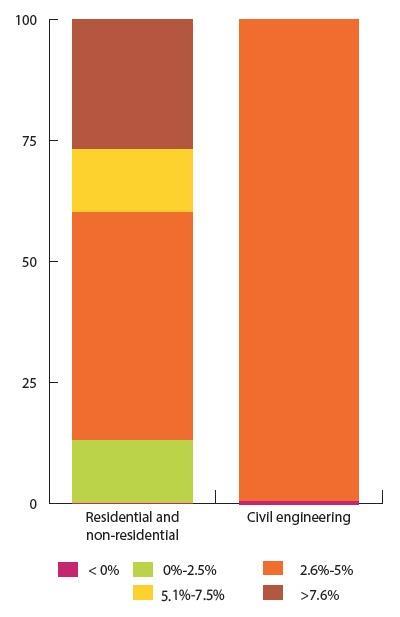
03 / Material costs
During September 2015 a large proportion of civil engineering respondents reported less than three months of work in hand (70.6%), while for the residential and non-residential sectors this was 40.5% and 47.1% respectively. At 31%, the residential sector has the highest amount of work in hand over the next three to six months once again. With 32.4% being greater than six months, the non-residential sector has the highest in this time bracket. The residential sector reported that a similarly high 28.6% of work was available after six months. Civil engineering firms stated that there was no work available over six months.
04 / Regional perspectives
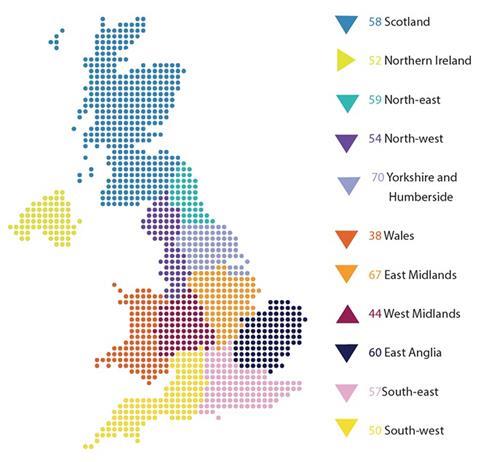
Experian’s regional composite indices incorporate current activity levels, the state of order books and the number of tender enquiries received by contractors to provide a measure of the relative strength of each regional industry.
The majority of the regions and devolved nations in the UK were left with weakened indices in September. The only region to strengthen was the West Midlands (44), with a one point increase. Despite this, it remained below the no-change mark along with Wales. Yorkshire and Humberside still holds the highest valued index at 70, despite a five point decrease in September. The North-east (59) and East Midlands (67) similarly weakened by five points. East Anglia (60) and the South-west (50) both decreased by the largest magnitude of six points in September. Northern Ireland at 52 points was the only region to remain unchanged with its index value for the previous month. Scotland (58) and Wales (38) both experienced decreases of three points, the South-east fell by two points and the North-west (54) weakened by a single point.
The UK index (54), which includes firms working in five or more regions followed suit with the majority of individual regions falling four points, whilst remaining above the no change mark of 50.
This an extract from the monthly Focus survey of construction activity undertaken by Experian Economics on behalf of the European commission as part of its suite of harmonised EU business surveys. The full survey results and further information on Experian Economics’ forecasts and services can be obtained by calling 0207-746 8217 or logging on to www.experian.co.uk/economics.
The survey is conducted monthly among 800 firms throughout the UK and the analysis is broken down by size of firm, sector of the industry and region. The results are weighted to reflect the size of respondents. As well as the results published in this extract, all of the monthly topics are available by sector, region and size of firm. In addition, quarterly questions seek information on materials costs, labour costs and work-in-hand.
1 CFR’s Leading Construction Activity Indicator incorporates a range of factors to assess the construction industry’s prospects over the next quarter. The indicator is put together using information about past levels of activity, orders and tender enquiries.


No comments yet