Activity remained in negative territory in January, according to Experian Economics. However, civil engineering showed promise with activity at an eight-month high and new orders above normal
01 / THE STATE OF PLAY
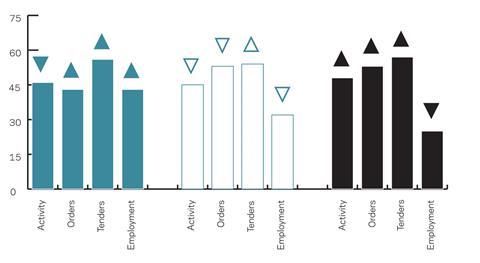
The construction activity index remained in negative territory at the start of 2012 signalling a 15th successive monthly decline in activity. However, the index was unchanged from the previous month at 47. Activity declined across all three sectors in January; following a brief return to positive territory at the end of 2011, the residential activity index fell by six points to 46. The activity index for the non-residential sector also declined, falling by three points to 45. In contrast, the civil engineering activity index reached an eight-month high, but was still in negative territory at 48.
Tender enquiries increased across all sectors in January, with the residential tender enquiries index rising by 12 points to a 13-month high of 56. However, tenders were largely not translating into new orders, as total new orders remained below normal for the time of year in January. That said, the non-residential and civil engineering new orders indices posted 53, pointing to above normal orders, but the residential orders index was below 50 at 43. Nevertheless, this was an increase of five points on the previous month’s reading.
In January, the proportion of respondents reporting no constraints on activity fell to 15%, the lowest percentage since December 2010. Around 59% of firms indicated that insufficient demand was constraining activity, only slightly below the previous month when the proportion hit a record 60% of respondents. Bad weather was reported as a limiting factor on activity by 6% of firms, the highest proportion since the snowy conditions at the beginning of 2011.
02 / LEADING CONSTRUCTION ACTIVITY INDICATOR

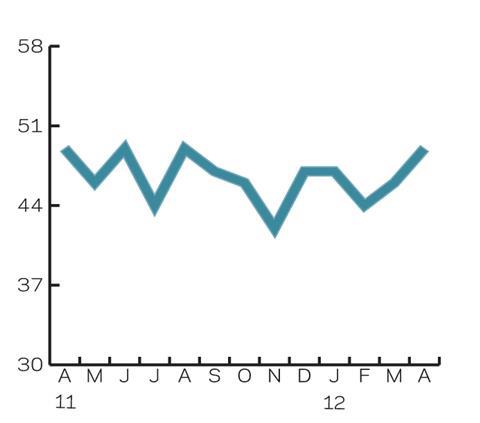
According to CFR’s Leading Construction Activity Indicator, construction activity is predicted to continue to decline over the coming three months. The pace of contraction is expected to accelerate in February, with the index falling to 44, before easing in both March and April, when it is predicted to rise to 49, signalling a weaker rate of decline.
The indicator uses a base level of 50: an index above that level indicates an increase in activity, below that level a decrease

03 / LABOUR COSTS
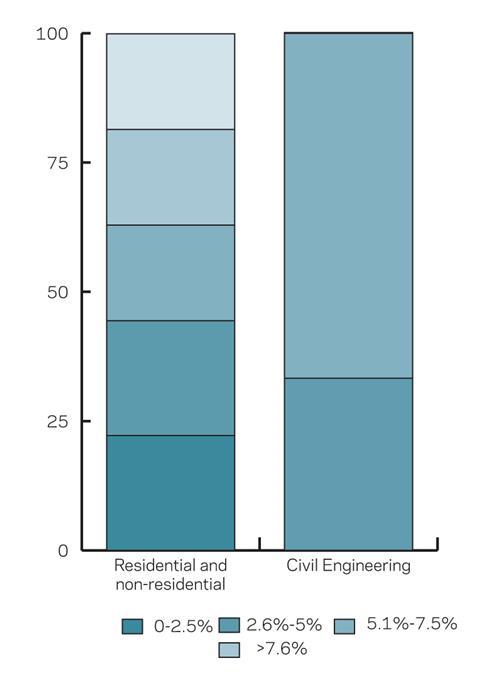
In January, around 22% of building firms reported that labour costs had fallen on an annual basis, down from 33% three months ago. The proportion of building firms indicating that annual labour cost inflation was between 0 and 2.5% was broadly unchanged at 22% in January from October last year. Three months ago, just 3% of building firms indicated that annual labour cost inflation was between 5.1 and 7.5% but that rose to 19% in January.
Around one-third of civil engineering firms indicated that annual labour cost inflation was between 0 and 2.5% in January, a fall from 50% three months ago. The remaining 67%of respondents in the sector reported that labour costs had risen by between 2.6 and 5% on an annual basis, twice as many as in October last year. In contrast, no firms in the sector reported a decrease in annual labour costs at the beginning of 2012 compared with 17% three months ago.

04 / REGIONAL PERSPECTIVE

Experian’s regional composite indices incorporate current activity levels, the state of order books and the number of tender enquiries received by contractors to provide a measure of the relative strength of each regional industry.
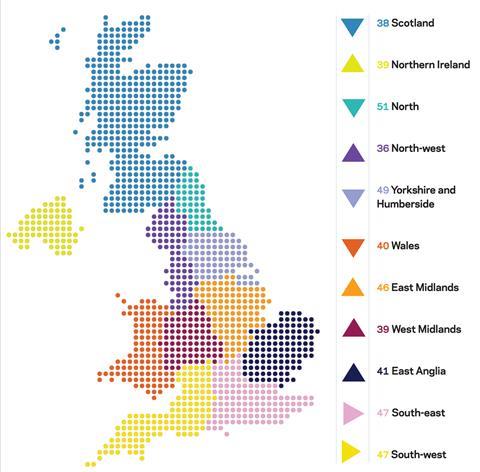
The North was the only region or devolved nation whose index was in positive territory in January. However, the index edged down for a second successive month, falling by two points to 51.
Of the remaining 10 regions and devolved nations, there were improvements in five indices, while they still remained in negative territory. The indices for the South-east and South-west were both unchanged at 47.
The strongest improvement was seen in the East Midlands, where the index rose by six points to five-month high of 46. The index for Northern Ireland increased by four points to 39 while the West Midland’s index saw a three-point rise to also take it to 39. The indices for the North-west and East Anglia both edged up by one point, to 36 and 41, respectively.
Wales saw the most marked decline as its index fell by four points to 40, its lowest reading since September 2010. The Scottish index declined by three points to 38, while Yorkshire and Humberside’s index fell by two points to 49. This was the first time it had been in negative territory since May 2011.
The UK index, which includes firms working in five or more regions, edged up by one point to 53.


No comments yet