


This year’s tables reveal a growing divide between the industry’s haves and have-nots
INTERACTIVE TABLES >>
TOP 150 CONTRACTORS AND HOUSEBUILDERS
TOP 75 CONTRACTORS
TOP 25 HOUSEBUILDERS
TOP 40 CONTRACTORS IN SERVICES & MAINTENANCE
The top line figures from Building’s annual listing of the UK’s 150 biggest contractors and housebuilders make for encouraging reading for the firms involved, if not the industry as a whole. While overall construction output fell 8% in 2012, revenues among the 150 biggest firms in the sector rose by 2.9%, from £79.97bn in 2011 to £82.29bn, following an increase of 3% between 2010 and 2011.
It may be of little comfort to small and medium-sized companies, but this disparity between how the industry’s biggest players perform and construction as a whole is to be expected. “When the market is buoyant, every man and his dog gets a piece of the action, but when the market shrinks or gets tighter the majors take a bigger share,” says Tony Williams, an analyst at Building Value.
What is also evident from this year’s listing is that performance varies significantly between sectors. So who have been the winners and losers?
Revenues from traditional contracting work among the 150 were down a further 1.7% in 2012 - to £44.04bn from £44.79bn in 2011 - having recorded declines every year since the financial crisis began in 2008. And it should be remembered that these big firms are almost certainly doing better than the smaller ones.
Conversely, the last year saw a significant comeback by the UK’s biggest housebuilders, which partly explains why revenues among the top 150 are up overall. Between 2011 and 2012, housing revenues among the top 150 increased 16.8%, from £12.56bn to £14.67bn, although housing turnover is still some way off the pre-crash peak of £24.40bn recorded in 2006.
The big companies have been switching more towards services. There are higher margins, longer-term revenue streams and less risk
Stephen Rawlinson, Whitman Howard
What’s more, it is already pretty clear that the big housebuilders’ 2012 success was no flash in the pan. Earlier this month a clutch of volume housebuilders reported strong results and trading conditions boosted by government efforts to stimulate the market.
For instance, Barratt said it beat market expectations during the first six months of 2013, with its sales rate up 17.9% on the previous year, and Taylor Wimpey said it would report increasing profit for the first half of 2013. Similarly, Bovis Homes reported a 40% increase in private reservations in the first half of 2013 compared with the same period in 2012.
Once again, however, the experience of the big firms differs significantly from the private housing sector as a whole. “Despite all the government policies to stimulate housebuilding, private starts fell by 7% last year,” says Noble Francis, economics director at the Construction Products Association (CPA). “However there is a big difference between what’s happening at major housebuilders and SMEs. The major housebuilders all reported that they’d increased units and had margins around 10%-12% last year. The majority of those are focusing their work around Greater London and the South-east, where you’ve got higher prices as well.”
This year’s top 150 also shows that revenues for services and facilities management (FM) work were up significantly in 2012, following strong growth in 2011.
The combined revenues for services and FM came to £19.61bn in 2012, compared with £18.41bn in 2011 and £16.84bn in 2010. What’s more, services and FM work increasingly constitutes a greater proportion of the top 150’s overall revenue. Back in 2007, the sector accounted for just 15% of the total compared with 24% last year.
According to Stephen Rawlinson, an analyst at Whitman Howard, the move towards greater reliance on services and FM revenues makes good business sense, particularly at a time when contracting work is less plentiful and less profitable. “Obviously these companies have been switching more towards services,” he says. “There are higher margins to be had, longer-term revenue streams and less risk.”
The CPA’s Francis notes that Carillion really led the way in terms of major contractors bidding for and winning more services and FM work. “Following Carillion’s lead, it’s an area that a lot of companies want to get into, if only because it’s more stable than general construction because it’s long-term framework contracts and steady work,” he says. “So, when a recession happens it’s not going to collapse.”
It’s always easier to chop an overhead internally and have an expenditure on a monthly or quarterly basis
Tony Williams, Building Value
Building Value’s Williams adds that it is likely that there has been an increase in the volume of services and FM contracts up for grabs in recent years, mainly as a result of the recession and public and private sector clients looking to cut their overheads by outsourcing. “Both the government and the private sector would be looking at their own overheads and it’s always easier to chop an overhead internally and to have a revenue expenditure on a monthly basis or a quarterly basis,” he says.
Williams adds that contractors such as Laing O’Rourke, Interserve and Mears have all increased their focus on services and FM. Kier’s £221m acquisition of May Gurney earlier this month, which pushed the contractor from sixth to fourth in the table, designed to give the contractor a much bigger FM offering, and is perhaps the most tangible example of the trend.
However, the higher number of companies bidding for services and FM work has inevitably increased competition in the sector, the results of which are already evident. Back in 2008, the average operating margin that top 150 firms achieved for services and FM contracts was 5.6%. In 2012, the equivalent figure was 4.9%. “I’m not at all surprised that there has been some margin attrition there,” says Williams.
Clients are also less likely to get locked into long-term contracts with high margins than they once were, according to Whitman Howard’s Rawlinson. “I think that the customers are getting a bit smarter, particularly government,” he says. “After 10-15 years of increasing outsourcing it’s now learning to do it better.”
So, while the overall picture for this year’s top 150 is one of solid, if not massively exciting, growth, it’s clear that this positive trend is propped up by an increasingly strong housing market and an ever greater reliance on picking up services and FM contracts. The industry will only feel that it has turned a corner once contracting revenues finally begin to grow.
YEAR-ON-YEAR REVENUE INCREASE/DECREASE 2006-12 BY SECTOR
| Year | Contracting | Housing | Property | Services/FM | Other | Total |
|---|---|---|---|---|---|---|
| 2012 | -1.7 | 16.8 | -7.5 | 6.5 | -5.5 | 2.9 |
| 2011 | -0.1 | -1.9 | 15.9 | 9.4 | 34.9 | 3.0 |
| 2010 | -6.2 | 1.0 | -13.3 | -10.3 | -17.9 | -6.5 |
| 2009 | -5.8 | -30.4 | -49.5 | 25.0 | 9.9 | -5.5 |
| 2008 | 18.5 | -16.6 | -37.6 | 21.1 | 19.5 | 8.5 |
| 2007 | 16.5 | -10.9 | 48.1 | 12.0 | -50.8 | 3.2 |
| 2006 | 4.5 | 10.3 | -7.8 | -16.3 | 101.9 | 5.8 |
AGGREGATE % OPERATING MARGINS 2006-12 BY SECTOR
| Year | Contracting | Housing | Property | Services/FM | Other |
|---|---|---|---|---|---|
| 2012 | 2.1 | 10.8 | 10.2 | 4.9 | 6.5 |
| 2011 | 2.8 | 8.3 | 6.8 | 5.5 | 5.7 |
| 2010 | 3.3 | 6.1 | 1.2 | 5.5 | 5.1 |
| 2009 | 3.0 | 2.4 | -4.9 | 5.4 | 6.2 |
| 2008 | 2.9 | 10.4 | 12.1 | 5.6 | 6.2 |
| 2007 | 3.0 | 16.1 | 14.5 | 4.9 | 7.5 |
| 2006 | 2.4 | 15.9 | 22.7 | 4.5 | 4.7 |
Directors’ pay: A ‘healthy’ fall?
Over the course of the recession the remuneration of company directors at the top 150 firms has, in relative terms, fallen further than average wages. The overall pay of the firms’ highest paid director on average increased by 7% between 2008 and 2012, which when general inflation is taken into account means that real wages fell 9.1%. This is compared with a 9.3% dip in average wages. “Their bonus incentives have obviously taken the hit,” says Tony Willams, an analyst at Building Value. “I’m sure that their basic salaries are still intact, if not better than they were.”
Williams argues that the fact that directors’ remuneration has performed worse than average salaries shows that performance-related schemes are, to some extent, working as intended. “I think that’s healthy. It shows that they are putting their hands up,” he says. “It’s good that if you’re not creating the earnings then you’re not getting the incentives. I would applaud that - I think that’s very positive news.”
Not everybody is quite so positive, which is perhaps unsurprising given that the average wage of a top 150 boss remains almost 15 times higher than that of the average employee - £560,000 compared with £38,800. Stephen Rawlinson, an analyst with Whitman Howard, says: “They’re already massively overpaid anyway and given what those chimps have produced over the last few years they don’t deserve to get more money for it. I think that they are already massively well paid and it’s hard to justify.”
HIGHEST-PAID DIRECTORS 2012* (£000)
| Company | 2011 | 2012 | % change |
|---|---|---|---|
| Bowmer & Kirkland | 4,797 | 3,152 | -34.3 |
| Fairview Holdings | 426 | 2,660 | 524.4 |
| Interserve | 900 | 1,739 | 93.2 |
| Persimmon | 1,658 | 1,729 | 4.3 |
| Taylor Wimpey | 1,502 | 1,661 | 10.6 |
| Barratt | 1,028 | 1,637 | 59.2 |
| Bellway | 1,240 | 1,382 | 11.5 |
| MITIE | 1,266 | 1,359 | 7.3 |
| Higgins Group | 1,159 | 1,287 | 11.0 |
| Morgan Sindall | 976 | 1,170 | 19.9 |
* Excludes pensions
DIRECTORS WITH THE GREATEST PAY INCREASE 2011-12* (£000)
| Company | 2011 | 2012 | % change |
|---|---|---|---|
| Ardmore Construction | 60 | 489 | 715.0 |
| Fairview Holdings | 426 | 2,660 | 524.4 |
| Morrison Utility Services | 250 | 530 | 112.0 |
| Clugston | 263 | 541 | 105.7 |
| Interserve | 900 | 1,739 | 93.2 |
| Keller | 436 | 821 | 88.3 |
| John Sisk & Sons | 425 | 797 | 87.8 |
| Miller | 624 | 1,164 | 86.5 |
| Imtech Technical Services | 352 | 637 | 81.0 |
| Keepmoat | 584 | 1,053 | 80.3 |
* Figures include salary and bonuses, excluding pensions, of the highest paid directors in each firm
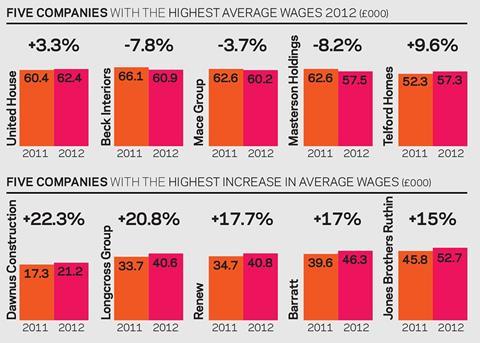
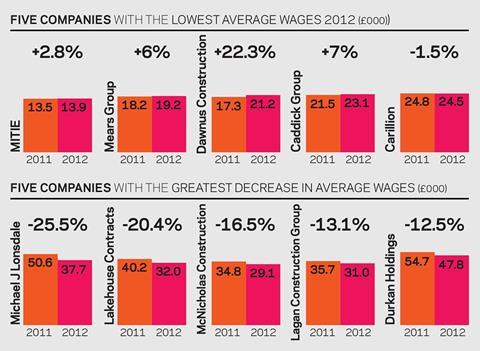
Wages: That sinking feeling
Changes to average wages in this year’s top 150 follow a similar pattern to that seen in the rest of the economy. In other words, remuneration has failed to keep pace with inflation, leading to an overall fall in living standards.
In the last four years - between 2008 and 2012 - average wages at the 150 biggest contractors and housebuilders increased by 8.4%. However, the same period saw general inflation of 17.7%, meaning that real wages fell by 8.9%. Taken by itself that is a sobering statistic, but it is particularly so when one considers that before the 2008 crash, construction professionals had been used to strong year-on-year increases in real wages. Between 2004 and 2008, average wages in the top 150 firms increased by 26% which, with general inflation of 12.3%, means that real wages increased by 12.2% in the same period.
*The average wage is calculated by dividing a firm’s total wage bill by the average number of salaried staff it has over the course of a year. Note that average wages may change for a variety of reasons and that an increase or decrease does not necessarily mean that individuals’ remuneration has changed for better or for worse.
INTERACTIVE TABLES >>
TOP 150 CONTRACTORS AND HOUSEBUILDERS
TOP 75 CONTRACTORS
TOP 25 HOUSEBUILDERS
TOP 40 CONTRACTORS IN SERVICES & MAINTENANCE


No comments yet