


There is little movement in this year’s Top 200 Consultants league tables, but don’t take that to mean the outlook is calm for the sector. On the contrary, the predictions are for more mergers, falling incomes and ever tighter margins

There is an eerie calm about this year’s Top 200 Consultants tables. The number of chartered staff across the 200 firms surveyed is down - but only by 0.3% - while fee income grew - but only by 0.8%. The top 10 firms are the same 10 firms as last year, and in precisely the same order, as if nobody dare move. But there is enough evidence in the tables and the accompanying survey compiled by Hewes & Associates to suggest that this stillness is misleading - margins are tighter than ever and fee income is still more than 20% below its 2009 peak. Rather, it seems that we have reached the eye of the storm. And, as weather-watchers will know, that means it is about to hit again.
Best of British?
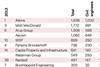
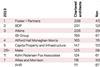
At first glance, the Top 200 (click here for the interactive tables) could be seen as a fitting coda to a very patriotic British summer, with some of these shores’ most venerable institutions showing their almost regal durability through a time of national strife. Atkins, founded by Sir William Atkins in 1938, has seen off the American upstarts, Aecom, URS and Jacobs, to take its habitual place at the top of the charts, with 3,296 UK chartered staff. Norman Foster, the closest that British architecture comes to a divine monarch, has expanded to take over at the head of the architects’ table, with 318 loyal chartered subjects. And sprightly 101-year-old EC Harris has added 26 chartered staff to return to the top of the QSs. “It’s been a satisfying year in a very tough market,” says chief executive Philip Youell. “We have grown in the Middle East and Asia, we have more US clients than ever … and we’re working on about 75% of the high-end residential developments in London.”
On closer examination, however, these last vestiges of the golden summer dissolve into the gathering gloom. Foster’s success, for example, owes as much to perennial table-topper BDP’s annus horribilis as to its own performance: BDP’s turnover fell from £86m to £62m in 2011, leading to the announcement of widespread redundancies last October. It now has 260 chartered architects, some 100 fewer than in last year’s tables.
Youell, meanwhile, acknowledges that much of EC Harris’ US growth is “care of our colleagues in Arcadis”, having been bought by the Dutch consultant in November. It has therefore joined the growing list of UK consultants to be snapped up by international buyers in recent years, including Halcrow, Currie & Brown, Scott Wilson, WSP and Davis Langdon.
And even the mighty Atkins has had a less than glittering year: its UK fee income fell by 6% and it has 160 fewer UK chartered staff than in 2011 - the biggest fall in the top 10. The most dynamic performer was arguably sixth-placed Jacobs - the US engineer increasing its fee income by 90.6% from £320m to £610m.
The gathering storm
It is still just about possible to detect a spirit of optimism spreading down the tables. It is often a sign that development is picking up when architects begin to boost their ranks, and this year mid-sized design practices are among the fastest growers in terms of staff numbers, with KSS Design Group and David Morley Architects expanding by 46.2% and 28.9% respectively. Allford Hall Monaghan Morris, meanwhile, has joined the ranks of the big hitters, adding 41% more UK staff to leap from 16th to seventh in the architects’ table; this on the back of prestigious project wins such as the new Google headquarters in King’s Cross.
Gary Whittle, managing director of architect Broadway Malyan (whose fee income rose 18% last year), says that despite the impact of the continuing eurozone crisis and the current harsh trading environment, there are reasons for architects to be hopeful - even if some of these lie abroad. “We see overseas investment into the prime luxury residential sector remaining buoyant, and the Treasury’s review of PFI is promising to release new funding
for public procurement,” he says. “We also believe that the National Planning Policy Framework promises to give the government’s pro-development bark its bite.”
The last year has also seen a surprising number of rises in wages. In 2009, Hewes’ survey showed that 11% more firms had reduced pay than increased it; last year the pendulum swung to a balance of 36% raising it; and this year that rose to 47%. The proportion of firms expecting to raise wages again in the next six months is also marginally higher than last year, with a balance of 32% rather than 30%.
It would be wrong, however, to think that rising wages reflect a return to rude financial health. Indeed they are something of an anomaly when you consider that, over the past three years, fee income has fallen more steeply than staff numbers (while fees are 22% lower than the peak of the market in 2009, staff levels are down 19%). Neill Morrison, partner at Drivers Jonas Deloitte, says that sometimes employers have little choice but to raise pay. “I don’t think businesses can afford to cut any further - staff will walk out on them. What we’ve seen in the last year or so is that there are some opportunities for talented staff, and people have to match that or lose their high-fliers. You have to pay talent.”
The money, though, still has to come from somewhere, and fee income is proving stubbornly resistant to growth. The “new reality”, according to Martin Hewes, director of Hewes & Associates, is that most firms are working more for the same or less fee income, positioning themselves for market share rather than profit. “With demand relatively weak, clients are demanding more and consultants are having to deliver,” he says. Respondents to Hewes’ survey cited issues such as lengthening procurement and bidding processes, the public sector’s “more for less” mantra and mission creep in terms of project scope. This, in turn, leads to staff working longer hours, putting more pressure on businesses to raise wages and increase headcount.
Ultimately, the only release from this pressure can come from companies’ margins. Four years into the downturn, Hewes’ analysis shows that these are still getting tighter. In 2007, 5% of firms reported margins of 3% or below, but by 2011 this had risen to 15%, and it has increased slightly again this year, to 16%. Meanwhile, the number of firms reporting margins of 8% or above has fallen from 56% in 2007 to 42%. In other words, despite the outward calm, the consultancy sector is ill prepared for a sharp downturn.
And the really bad news …
Unfortunately, of course, that is precisely the situation in which the UK construction sector finds itself. The Construction Products Association’s forecasts for the next three years make uninviting reading, with output expected to fall 4.5% this year and 1.3% next, before returning to growth in 2014. Hewes’ predictions are even grimmer, suggesting falls of 7.8%, 4.3% and 0.9% over the next three years, which will leave output some 12.5% - or £13.5bn - below 2011 levels by the end of 2014.
Needless to say, such a multibillion-pound shortfall will have a drastic effect on the consultancy sector. “Consultants will have to chip away at their cost base in an effort to protect margins,” says Hewes. “For some, this may not be sustainable while clients demand more for less - unless they cut costs and fees. For others, merging with another firm may prove the best way forward.”
EC Harris’ Youell agrees that we haven’t seen the end of consolidation in the sector. “The big are going to get bigger and broader in terms of their capabilities … If you’re a mid-sized firm it’s going to be difficult to compete.”
And those that do get subsumed into a bigger operation may find that their new parents look for growth abroad rather than in the declining UK market. Davis Langdon is an interesting case in point here. In 2009, it was the second-ranked surveyor, with 743 chartered staff. After suffering job losses in 2010, it then became part of US giant Aecom, but it has continued to slip slowly down the QSs’ table, to sixth from last year’s fourth. In 2012, Aecom has 590 UK chartered surveyors - less than half the headcount at EC Harris.
But Bob Pell, chief executive of Aecom’s programme, cost and consultancy practice, points out that this fall masks expansion elsewhere: “We continue to grow our teams in emerging markets such as CIS [the Commonwealth of Independent States], Russia and most recently in Asia, where we have recently announced our intention to merge with KPK, one of the leading cost consultancies in the region.”
Meanwhile, while the larger beasts look to foreign fields, there may be opportunities for new and niche players to capitalise, thanks to their lower cost base. Morrison, whose Drivers Jonas Deloitte division was formed last year and has just 22 cost consultants, says: “For the large consultancies, there’s nowhere they can hide, apart from abroad. But as a new business, it is easier for us to win work in a shrinking market and grow.”
The aim for most, however, will yet again be survival rather than growth. It seems unlikely that the static nature of this year’s tables will be repeated in 2013. The winds are picking up.
TOP CONSULTANT SURVEY RESULTS compiled by Hewes & Associates
Do you plan to reduce, leave unchanged, or increase salaries over the next six months?
| 2008 | 2009 | 2010 | 2011 | 2012 | |
| Reduce | 0 | 3 | 1 | 1 | 2 |
| Leave unchanged | 4 | 87 | 75 | 68 | 65 |
| Increase | 96 | 10 | 23 | 31 | 34 |
Have you move staff onto a shorter working week over the past year?
| 2009 | 2010 | 2011 | 2012 | |
| Yes | 13 | 12 | 6 | 3 |
| No | 87 | 88 | 94 | 97 |
On average, what are your margins?
| 2007 | 2008 | 2009 | 2010 | 2011 | 2012 | |
| <3% | 5% | 3% | 7% | 11% | 15% | 16% |
| 4-6% | 17% | 18% | 23% | 27% | 24% | 24% |
| 6-8% | 22% | 20% | 18% | 19% | 18% | 18% |
| >8% | 56% | 59% | 52% | 43% | 43% | 42% |
On average, in which direction are your margins moving?
| 2003 | 2004 | 2005 | 2006 | 2007 | 2008 | 2009 | 2010 | 2011 | 2012 | |
| Up | 28% | 40% | 38% | 43% | 56% | 31% | 9% | 16% | 13% | 18% |
| Level | 57% | 50% | 54% | 48% | 40% | 52% | 34% | 49% | 50 | 51% |
| Down | 15% | 10% | 8% | 9% | 4% | 17% | 57% | 35% | 37% | 31% |
What % of staff have you laid off over the past 12 months? (bands changed for 2012)
| 2009-2011 | from 2012 | 2009 | 2010 | 2011 | 2012 |
| 0-25% | 0-5% | 84 | 97 | 100 | 87 |
| 25-50% | 5-10% | 7 | 1 | 0 | 8 |
| 50-100% | >10% | 9 | 2 | 0 | 5 |
Are you planning to increase, leave unchanged or decrease staff levels over the next six months?
| 2008 | 2009 | 2010 | 2011 | 2012 | |
| Increase | 70 | 24 | 38 | 48 | 53 |
| Leave unchanged | 18 | 66 | 52 | 44 | 45 |
| Decrease | 12 | 10 | 10 | 8 | 2 |
Have you reduced, left unchanged, or increased salaries over the past year?
| 2009 | 2010 | 2011 | 2012 | |
| Increased | 17 | 18 | 42 | 52 |
| Left unchanged | 55 | 59 | 52 | 43 |
| Decreased | 28 | 23 | 6 | 5 |
What are your expectations regarding trading conditions over the next 12 months?
| 2009 | 2010 | 2011 | 2012 | |
| Worse | 23 | 32 | 18 | 15 |
| Stability | 61 | 51 | 59 | 69 |
| Improve | 16 | 17 | 23 | 16 |
What % of fee income relates to overseas work?
| 2008 | 2009 | 2010 | 2011 | 2012 | |
| Of those with o/s income, the average was | 14.5% | 19.5% | 20% | 20% | 22% |
Are you planning to increase % of overseas fee income?
| 2008 | 2009 | 2010 | 2011 | 2012 | ||
| All companies | Yes | 63% | 56% | 57% | 58% | 57% |
| Those with existing o/s business | Yes | 89% | 82% | 81% | 80% | 83% |
| Those with no existing o/s business | Yes | 31% | 25% | 27% | 35% | 22% |
What % of your fee income relates to public sector work?
| 2009 | 2010 | 2011 | 2012 | |
| 0-25% | 32 | 32 | 37 | 43 |
| 25-50% | 23 | 26 | 25 | 22 |
| 50-75% | 31 | 26 | 27 | 25 |
| 75-100% | 14 | 16 | 11 | 10 |
Are you planning on winning more infrastructure work?
| 2010 | 2011 | 2012 | |
| Yes | 51% | 52% | 53% |
| No | 49% | 48% | 47% |
To what extent are you concerned about public expenditure cuts?
| 2010 | 2011 | 2012 | |
| Very concerned | 30% | 30% | 22% |
| Concerned | 61% | 59% | 75% |
| Not concerned | 9% | 11% | 3% |
Do you expect to take advantage of any increase in public outsourcing work?
| 2010 | 2011 | 2012 | |
| Yes | 60% | 62% | 62% |
| No | 40% | 38% | 38% |
Are you winning more refurbishment and/or retrofitting work?
| 2011 | 2012 | |
| Yes | 75% | 73% |
| No | 25% | 27% |
Do you expect mergers/takeovers to become more widespread?
| 2010 | 2011 | 2012 | |
| Yes | 87% | 87% | 80% |
| No | 13% | 13% | 20 |
Full the interactive tables and raw data supplied by Hewes & Associates click here


No comments yet