New housing construction is primary reason for total construction increase since Q3 2013. Total employment figures increase year-on-year
01/ Key changes
- Construction output fell by 0.95% in March 2014 when compared to February 2014. But output compared on a quarterly basis rose by 0.64% in Q1 2014 versus Q4 2013
- New housing construction is the primary reason for total construction output increasing since Q3 2013
- Construction materials prices posted a muted overall increase despite some notable changes to sector-related materials
- Metals prices recorded either slight declines or modest gains, with indices falling overall
- Rate of consumer price inflation fell for the sixth consecutive month in March, the first time this has happened since records began in 1997, but rebounded in April
- Construction average weekly earnings increase on a yearly basis but fall month-on-month in March 2014
- Total employment in construction increased by 4.5% on an annual basis at the end of 2013
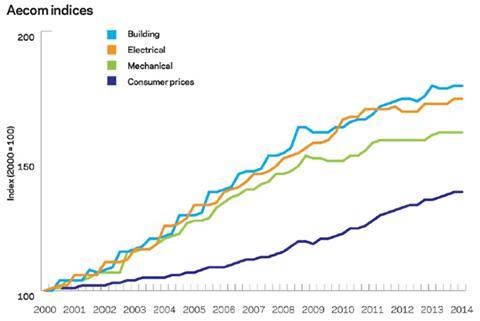
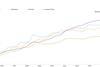
The chart below shows Aecom’s index series since 2000, reflecting cost movements in different sectors of the construction industry and consumer prices.
Percentage change year-on-year (Q1 2013 to Q1 2014)
| % | Direction | |
|---|---|---|
| (2014 Q1 figures are provisional) | ||
| Building cost index | 0.2 | ▲ |
| Mechanical cost index | 1.1 | ▲ |
| Electrical cost index | 1.1 | ▲ |
| Consumer prices index | 1.8 | ▼ |
Building cost index
Although building costs rose marginally in the year to Q1 2014, the rate of change slowed significantly to 0.23%. Some of this sharp fall results from the delayed effects of wage agreements being implemented later in 2014.
Mechanical cost index
The mechanical cost index slipped to 1.14% increase year-on-year in Q1 2014. This is the lowest increase in the last three quarterly updates.
Electrical cost index
The electrical cost index mirrored mechanical costs in the size of change, and is the only index to increase when compared with Q4 2013.
Consumer prices index
Annual inflation rate falls under the Bank of England’s target of 2%. Petrol prices contributed the largest component of the decline.
Guide to data
Aecom’s cost indices track movements in the input costs of construction work in various sectors, incorporating national wage agreements and changes in materials prices as measured by government index series.
They are intended to provide an underlying indication of price changes and differential movements in the various work sectors but do not reflect changes in market conditions affecting profit and overheads provisions, site wage rates, bonuses or materials’ price discounts/premiums. Market conditions are discussed in Aecom’s quarterly Market Forecast (last published April 2014).
02 / Price adjustment formulae for construction contracts
Price Adjustment Formulae indices, compiled by the Building Cost Information Service (previously by the Department for Business Innovation & Skills), are designed for the calculation of increased costs on fluctuating or Variation of Price contracts. They provide useful guidance on cost changes in various trades and industry sectors and on the differential movement of work sections in Spon’s Price Books.
Over the last 12 months, the 60 building work categories recorded an average fall of 0.08% on a yearly basis. A quarter-on-quarter increase of 0.39% underscores a muted theme of price movements in the majority of work categories, despite some larger rises in certain work categories.
| Mar 2013 - Mar 2014 | % change |
|---|---|
| Concrete | 2.3 |
| Slate and Tile Roofing | 2.6 |
| Softwood Joinery | 2.7 |
| Drainage Pipework (other than iron cast) | 2.6 |
| Plastic Pipes and Fittings | 3.0 |
| Sanitary Fittings | 3.1 |
| Bituminous Surface to Roads and Paths | 3.4 |
Many of the largest decreases are in work categories relating to metals, which reflect broader trends in global metal prices:
| Mar 2013 - Mar 2014 | % change |
|---|---|
| Jointless Flooring (Epoxy resin type) | -10.0 |
| Aluminium Sheet Roofing and Cladding | -6.2 |
| Copper Tubes, Fittings and Cylinders | -5.1 |
| Insulation | -4.0 |
| Leadwork | -3.7 |
| Dry Partitions and Linings | -3.2 |
| Steelwork | -2.7 |
| Steel Sheet Piling | -2.6 |
Materials
03 / Executive summary
- Consumer price inflation falls for the sixth consecutive month in March but this trend halted in April 2014 ▼
- Manufacturing input prices continue to fall sharply ▼
- Industry output prices slipped again in April 2014 ▼
- Metals prices posted mixed price trends, reflecting issues around Chinese demand and supply constraints ▼ ▲
- Construction materials price inflation remains muted despite some increases in certain materials categories ▼
04 / Key indicators
| Consumer prices | % change Mar 2013 - Mar 2014 | |
|---|---|---|
| Consumer prices index (CPI) | + 1.7 | ▼ |
The annual rate in March 2014 fell to 1.7% from 1.8% in February. This figure makes it the third consecutive month where CPI has returned under the Bank of England’s target rate of 2%.
| Industry input costs | % change Mar 2013 - Mar 2014 | |
|---|---|---|
| Materials and fuels purchased by manufacturing industry | -6.5 | ▼ |
| Materials and fuels purchased by manufacturing industry excluding food, beverages, tobacco and petroleum industries | -5.8 | ▼ |
Input price inflation has decreased since July 2013, with prices currently falling by 6.5% on an annual basis. Core input inflation, which excludes volatile items, is decreasing at broadly similar levels. Crude oil and imported metals accounted for the two largest component changes.
| Industry output prices | % change Mar 2013 - Mar 2014 | |
|---|---|---|
| Output prices of manufactured products | 0.5 | ▲ |
| Output prices of manufactured products excluding food, beverages, tobacco and petroleum | 1.0 | ▲ |
The annual rate of change for industry output prices fell from 0.6% in February to 0.5% in March 2014. This slip comes despite output prices rising by 0.1% month-on-month in March 2014. Output inflation has slowed steadily since Q3 2011 and is now the lowest annual rate since October 2009. The narrower core index fell marginally to 1.0% in March when compared to the same month a year earlier.
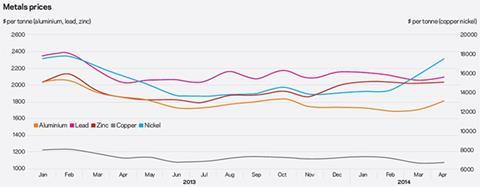
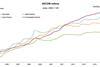
| Metals prices | % change Apr 2013 - Apr 2014 | |
|---|---|---|
| Copper | -7.4 | ▼ |
| Aluminium | -2.5 | ▼ |
| Lead | 2.7 | ▲ |
| Zinc | 9.6 | ▲ |
| Nickel | 11.1 | ▲ |
Copper and aluminium prices fell quite sharply since February, as concerns continue over the economic slowdown in China. But nickel and zinc posted solid yearly increases, partly due to recent global supply constraints.
Click here or on the graph to view a larger version
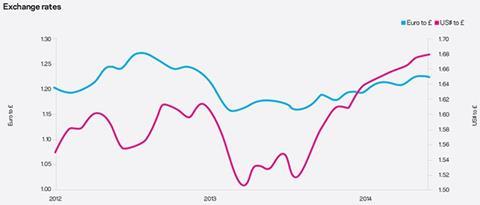
Exchange rates
| Apr 2013 average | Apr 2014 average | % change | |
|---|---|---|---|
| Euro to £ | 1.175 | 1.224 | +4.2 |
| U.S Dollar to £ | 1.532 | 1.679 | +9.6 |
Sterling continued its strong run as the UK economy posted better economic figures. Upward revisions to forecasts of future GDP growth and expectations of earlier than previously estimated bank rate rises have also contributed to sterling’s rise.
Click here or on the graph to view a larger version
Construction industry
Materials price increases for the construction industry over the last 12 months are detailed below:
| Construction materials general | % change Mar 2013 - Mar 2014 (provisional) | |
|---|---|---|
| New housing | +2.0 | ▲ |
| Non-housing - new work | +0.4 | ▼ |
| Repair and maintenance | +1.8 | ▲ |
Housing activity and demand for related materials accounted for much of the headline change in construction materials price inflation.
| Mechanical services materials | % change Mar 2013 - Mar 2014 (provisional) | |
|---|---|---|
| Housing only | -2.4 | ▼ |
| Non-housing | -1.0 | ▼ |
| Electrical services materials | -2.5 | ▼ |
Mechanical services materials fell on an annual basis after an extended period of static price movements. Recent declines reflect notable changes to global metal prices.
| % change Mar 2013 - Mar 2014 (provisional) | |
|---|---|
| Data sources: ONS and BIS | |
| Particle board | +6.2 |
| Imported sawn or planed wood | +4.2 |
| Sand and gravel (inc Levy) | +9.0 |
| Bricks | +7.2 |
| Plastic doors and windows | +3.9 |
| Coated roadstone (excl Levy) | +7.6 |
| Ready mixed concrete | +3.7 |
| Imported plywood | -6.6 |
| Fabricated structural steel | -4.6 |
| Crushed rock (inc Levy) | -3.0 |
Labour
05 / Labour market statistics
- In March 2014, average weekly earnings (total pay including bonuses) in construction fell to £529 from £547 in February. Although this represents a decline of 3% on the month, earnings rose on a yearly basis by 1.3%. With bonuses excluded, regular pay decreased marginally year-on-year by 0.3%.
- For the economy as a whole, both regular pay and total pay increased by 1.1% and 1.5% respectively.
- Total employment in construction increased by 91,000 in December 2013 when compared to 12 months earlier. While this represents an increase of 4.5%, the Q3 to Q4 2013 increase was lower at 2.5%.
06 / Wage agreements
Construction Industry Joint Council
The parties to the Construction Industry Joint Council have agreed a new pay deal, which sees pay rates increase by 3% from 30 June 2014, and a further 3% rise from 29 June 2015. Travel and fare allowances also increase from 30 June 2014, along with subsistence allowances increasing to £35 a night from 6 January 2015. The agreement also addresses changes to sick pay.
Joint Council Committee of the Heating, Ventilating and Domestic Engineering Industry
A 2.5% increase in hourly wage rates comes into effect from 6 October 2014. Amendments to the basic working week also apply from the same date, as the number of hours per week reduces from 38 to 37.5. Changes to the level of weekly sickness and accident benefit are also planned.
The Joint Industry Board for the Electrical Contracting Industry
Members have received a 2% rise in hourly wage rates from 6 January 2014.
Building and Allied Trades Joint Industry Council
The Building and Allied Trades Joint Industrial Council (BATJIC) recently agreed a two-year pay deal effective from 30 June 2014. The deal involves variable wage rises for the standard wage rates averaging 2.5%. A further set of rises averaging 3% come into effect from 29 June 2015. Annual holiday entitlement will increase by one day, as of 29 June 2015, from 21 days to 22 days, making a total of 30 days including public holidays.
The new BATJIC rates of wages are:
| Standard rates of pay for 39 hours per week | Per Week | Per Hour |
|---|---|---|
| S/NVQ3: Advanced | £436.80 | £11.20 |
| S/NVQ2: Intermediate | £376.35 | £9.65 |
| Adult General Operative | £327.60 | £8.40 |
| For entrants aged 19 years and over: - Third 12 months with NVQ2 - Third 12 months without NVQ | £344.37 £299.52 | £8.83 £7.68 |
| Apprentices under 19 years of age: - 18 years of age with NVQ - 18 years of age without NVQ2 | £308.51 £291.68 | £7.91 £7.48 |
Wage Agreement Summary
| Operatives | Agreement body | Current basic hourly rate | Effective since | Details in | Date of next review |
|---|---|---|---|---|---|
| Builders and civil engineering operatives | Construction Industry Joint Council | Craft rate: £10.99 / hour | 30 June 2014 | Spon’s Architects’ and Builders’ Price Book 2015 | 29 June 2015 |
| Building and Allied Trades Joint Industrial Council (BATJIC) | S/NVQ3 advanced craft: £11.20 / hour | 30 June 2014 | 28 June 2015 | ||
| Plumbers | The Joint Industry Board for Plumbing Mechanical Engineering Services in England and Wales | Advanced plumber: £13.70 / hour | 6 January 2014 | 5 January 2015 | |
| Scottish and Northern Ireland Joint Industry Board for the Plumbing Industry | Advanced plumber: £13.08 / hour | 7 July 2014 | Spon’s Architects’ and Builders’ Price Book 2015 | July 2015 | |
| H&V operatives | Joint Conciliation Committee of the Heating, Ventilating and Domestic Engineering Industry | Craftsman: £11.84 / hour | 6 October 2014 | Spon’s Price Book 2015 | 5 October 2015 |
| Electricians (national) | The Joint Industry Board for the Electrical Contracting Industry | Approved electrician: £14.86 / hour (own transport) | 6 January 2014 | Spon’s Mech & Elec Price Book 2015 | 5 January 2015 |
| Scottish Joint Industry Board for the Electrical Contracting Industry | Approved electrician: £14.86 / hour (own transport) | 6 January 2014 | Spon’s Mech & Elec Price Book 2015 | 5 January 2015 |


No comments yet