Materials cost inflation continues to rise, although the effects of sterling’s weakness are filtering out slightly and the increase in input costs has slowed. Michael Hubbard of Aecom reports
01 / Key changes
Percentage change year-on-year (Q2 2016 to Q2 2017)
| % | Direction | |
|---|---|---|
| Building cost index | +3.9 | ▲ |
| Mechanical cost index | +3.9 | ▲ |
| Electrical cost index | +2.5 | ▲ |
| Consumer prices index | +2.7 | ▲ |
(Q2 2017 figures are provisional)
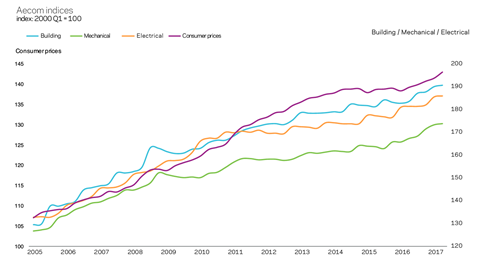
Building cost index
A composite measure of building costs increased over the past 12 months by 3.9% at Q2 2017. Materials cost inflation continues to increase, as do labour rates. Inflation arising from higher imported materials costs still plays a part in the reasoning, but the effect of sterling weakness is working its way through and out of the system for the time being. This may well increase once again, as the pound has fallen against the euro recently.
Mechanical cost index
The rate of annual change increased to 3.9% at Q2 2017. Both labour and materials components of the index increased, with the latter almost reaching 6% over the period.
Electrical cost index
The electrical cost index increased by 2.5% over the year. The materials component of the index recorded a 5% change in the 12 months to Q2 2017.
Consumer prices index
Consumer price inflation maintained a steady rate through the second quarter of 2017. The largest fall was recorded in motor fuel, but this was offset by increases in a range of other domestic goods and services.
The following chart shows Aecom’s index series since 2005, reflecting cost movements in different sectors of the construction industry and consumer prices.
02 / Price adjustment formulae for construction contracts
Price adjustment formulae indices, compiled by the Building Cost Information Service (previously by the Department for Business, Innovation and Skills), are designed to calculate increased costs on fluctuating or variation of price contracts. They provide guidance on cost changes in various trades and industry sectors – ie those including labour, plant and materials – and on the differential movement of work sections in Spon’s price books.
The 60 building work categories recorded an average increase of 1.6% on a yearly basis. Higher increases were recorded in the following categories:
Price adjustment formulae
| June 2016 – June 2017 | % change |
|---|---|
| Cladding and covering: lead | 16.5 |
| Cladding and covering: copper | 16.3 |
| Cladding and covering: zinc | 14.8 |
| Pipes and accessories: copper | 14.0 |
| Windows and doors: steel | 11.4 |
| Piling: steel | 8.3 |
The lowest yearly increases were in these groups:
Price adjustment formulae
| June 2016 – June 2017 | % change |
|---|---|
| Finishes: screeds | 1.5 |
| Concrete: reinforcement | 1.3 |
| Finishes: flexible tiles and sheet coverings | 1.3 |
| Concrete: in-situ | 0.8 |
| Pipes and accessories: clay and concrete | 0.6 |
| Finishes: rigid tiles and terrazzo work | 0.5 |
Materials
03 / Summary
- Consumer price inflation increased by 2.6% in July 2017 compared with the same month a year earlier ▲
- Manufacturing input prices increased 6.5% in the year to July 2017 ▲
- Factory gate prices (output prices) rose 3.2% in the year to July 2017 ▲
- Commodity prices in Q2 2017 reversed most of the falls seen at the start of the year ▲
- Construction materials prices continued to increase on an annual basis in Q2 2017 ▲
04 / Key indicators
Construction industry
The All Work materials price index increased by 4.7% in the 12 months to June 2017. Housing-related materials ascended 5% in the same period. Non-housing materials prices also rose, by 4.2% annually. All M&E categories posted significant yearly increases.
| Construction materials | % change | June 2016 – June 2017* |
|---|---|---|
| New housing | 5.0 | ▲ |
| Non-housing new work | 4.2 | ▲ |
| Repair and maintenance | 4.7 | ▲ |
| Mechanical services materials | % change | June 2016 – June 2017* |
|---|---|---|
| Housing only | 10.2 | ▲ |
| Non-housing | 5.9 | ▲ |
| Electrical services materials | 3.7 | ▲ |
| Materials showing largest cost movement | % change, June 2016 – June 2017 |
|---|---|
| Imported sawn or planed wood | +13.0 |
| Fabricated structural steel | +12.6 |
| Imported plywood | +6.7 |
| Doors and windows: metal | +6.1 |
| Sawn wood | +5.9 |
| Particle board | +4.4 |
| Crushed rock (including levy) | -0.3 |
| Ready-mixed concrete | -0.7 |
| Cement | -1.0 |
| Paint (aqueous) | -2.2 |
Data sources: ONS and BEIS
*provisional
UK economy
| Consumer prices | % change: July 2016 – July 2017 |
|---|---|
| Consumer Prices Index (CPI) | 2.6 ▲ |
Consumer price inflation rose by 2.6% in the 12 months to July. Consumer price inflation remains higher than overall earnings growth, contributing to falling real wage levels and a squeeze on consumer spending. With increased raw materials costs now passed into the supply chain and out to consumer prices, recent falls in the value of sterling will be watched for renewed effects on input cost inflation.
| Industry input costs | % change | July 2016 – July 2017 |
|---|---|---|
| Materials and fuels purchased by manufacturing industry | 6.5 | ▲ |
| Materials and fuels purchased by manufacturing industry excluding food, beverages, tobacco and petroleum industries | 5.5 | ▲ |
Input costs increased by 6.5% on a yearly basis to July 2017 – a notable slowing in the annual rate of change when compared with change in the preceding months of 2017, decreasing by 13.4% from a peak of 19.9% in January. Further consolation is found in the July figure as it records the slowest rate of annual change since July 2016 at 4.2%, while the monthly movement of 3.5% from June 2017 is the largest downward shift since April 2012. Moderate strengthening of sterling and a fall in crude oil by about 12% over H1 2017 are two reasons there is a slower rate of inflation for materials and fuels inputs.
| Industry output costs | % change | July 2016 – July 2017 |
|---|---|---|
| Output prices of manufactured products | 3.2 | ▲ |
| Output prices of manufactured products excluding food, beverages, tobacco and petroleum | 2.4 | ▲ |
Source: ONS
Factory gate prices increased 3.2% on a yearly basis in July. Falling input costs in recent months have contributed in part to a slower rate of overall output price growth. As recent large rises in input costs have eased a little, output prices have continued to increase steadily, offering some respite for producers in managing the balance between input cost pressure and output prices. However, the rate of change in output price inflation has slowed through 2017.
Metal prices
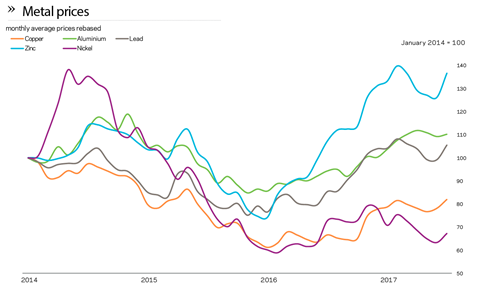
| % change | July 2016 – July 2017 | |
|---|---|---|
| Aluminium | 16.8 | ▲ |
| Copper | 23.1 | ▲ |
| Lead | 23.6 | ▲ |
| Zinc | 27.5 | ▲ |
| Nickel | -7.5 | ▼ |
Source: LME
Commodity prices mainly continued to make gains through the second quarter of 2017. This follows downward drift in prices through the preceding quarter. Prices are therefore at similar levels to those seen at the turn of the year. Global economic growth expectations are perceived to be improving, with corresponding knock-on effects on demand for metals commodities.
Exchange rates
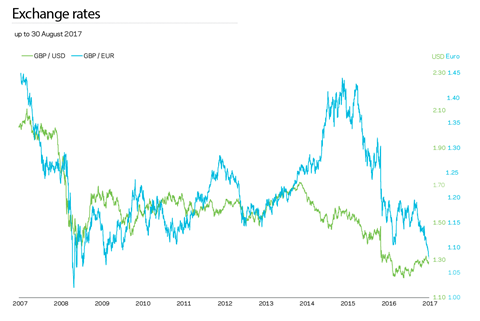
| July 2016 average | July 2017 average | % change | |
|---|---|---|---|
| GBP / EUR | 1.1884 | 1.1281 | -5.1 |
| GBP / USD | 1.3141 | 1.2994 | -1.1 |
Having followed broadly similar trends against the euro and the US dollar, sterling again lost ground against the euro during Q2 2017. It sank further more recently as eurozone economic confidence and performance beat the UK’s economic story,
and the situation is not helped by ongoing Brexit uncertainty weighing on the outlook. Against the US dollar, sterling’s performance is better, but this reflects changing views about the US economic landscape and political developments.
Labour
05 / Labour market statistics
- Average weekly earnings (total pay including bonuses) in construction increased to £586 in June 2017, from £581 a month earlier. Annually, total earnings increased just 2% in June on a single-month basis, and 0.2% annually on a three-month average basis. Regular pay (excluding bonuses and arrears) rose to £564 per week in June, with annual rates of 2.4% on a single-month basis and 1.9% using a three-month average.
- Construction industry regular and total pay rates of change are broadly in line with equivalent changes to average earnings for the whole economy classification.
- Real average weekly earnings for the whole economy fell by 0.4% (regular pay) in June 2017 when compared with June 2016.
06 / Wage agreements
Construction Industry Joint Council
Following negotiations between the parties to CIJC, the council has agreed a two-year agreement on pay and other conditions. This is the second phase of a two-year agreement reached in June 2016. Hourly pay rates will increase by 2.75% in June 2017. Industry sick pay and subsistence allowance will also increase in line with the basic pay rate increases. Workers will receive an extra day’s holiday from 1 January 2017, which is worth an additional 0.4%. For more details on apprentice rates, daily fare and travelling allowance and other rates, refer to CIJC document IR.2016.19.
Joint Council Committee of the Heating, Ventilating and Domestic Engineering Industry
A two-phase agreement has been agreed between BESA and Unite trade unions. Phase one comprises 2.0% and 2.5% increases in hourly wage rate effective from 3 October 2016 and 2 October 2017 respectively. Phase two, covering the periods 2018/2019 and 2019/2020, involves increases in index and other benefits agreed in July 2016. Introduction of calculating daily fare and travel allowances has been changed from kilometres to miles. Workers’ annual holiday is to increase from 23 to 24 days, effective from February 2020. For more information on the agreement, refer to JCC letter 117 of BESA.
The Joint Industry Board for the Electrical Contracting Industry
The electrical contracting industry has agreed on a four-year wage deal, effective from January 2017. There will be hourly wage increases of 2% in 2017, 2.5% in 2018, 2.75% in 2019 and 3% in 2020; also the introduction of a new mileage allowance and rate to replace travel allowance and travel time. Annual holidays are to increase to 23 days in 2019 and 24 days in 2020. For more information on the agreement, refer to the electricals’ and Unite wage agreement document – July 2016.
Building and Allied Trades Joint Industry Council
As the second part of a two-year agreement reached in 2016, this year will see a further 2.5% pay rise in all wage rates. Changes to employer pension contribution mean the minimum employer contribution prior to 5 April 2017 under pension auto-enrolment rules is 1% of pensionable pay between £5,824 and £42,385. From 6 April 2017 until 5 April 2019 this minimum employer contribution will rise to 2%. From 6 April 2019 onwards it will rise to 3%.
The Joint Industry Board for Plumbing, Mechanical Engineering Services in England and Wales
This is the second phase of the agreement finalised in 2015. Rates for workers in the JIB-PMES industry increased by 2%, effective from 2 January 2017.
Scottish and Northern Ireland Joint Industry Board for the Plumbing Industry
The SNIJIB has reached on a two-year wage deal effective from 3 July 2017. Hourly wage increases of 2% in 2017 and 2018 have been agreed. For more information, refer to SNIJIB wage agreement document – July 2017.
The BATJIC rates of wages effective from 26th June 2017 are:
| Standard rates of pay for 39 hours per week | Per week | Per hour |
|---|---|---|
| S/NVQ3: Advanced | £471.12 | £12.08 |
| S/NVQ2: Intermediate | £405.60 | £10.40 |
| Adult general operative | £359.97 | £9.23 |
| For entrants aged 19 years and over | ||
| Third 12 months with NVQ2 | £383.37 | £9.83 |
| Third 12 months without NVQ | £333.84 | £8.56 |
| Apprentices under 19 years of age | ||
| 18 years of age with NVQ2 | £315.51 | £8.09 |
| 18 years of age without NVQ2 | £333.84 | £8.56 |
WAGE AGREEMENT SUMMARY
The following table summarises the wage agreements currently in force for the principal wage fixing bodies within the construction industry
| Operatives | Agreement body | Current basic hourly rate | Effective since | Details in | Date of next review |
|---|---|---|---|---|---|
| Builders and civil engineering operatives | Construction Industry Joint Council | Craft rate: £11.93/hour | 26 June 2017 | Spon’s Architects’ and Builders’ Price Book 2018 | June 2018 |
| Building and Allied Trades Joint Industrial Council (BATJIC) | S/NVQ3 advanced craft: £12.08/hour | 26 June 2017 | Spon’s Architects’ and Builders’ Price Book 2018 | June 2018 | |
| Plumbers | The Joint Industry Board for Plumbing Mechanical Engineering Services in England and Wales | Advanced plumber: £14.70/hour | 2 January 2017 | Spon’s Architects’ and Builders’ Price Book 2018 | January 2018 |
| Scottish and Northern Ireland Joint Industry Board for the Plumbing Industry | Advanced plumber: £13.95/hour | 3 July 2017 | Spon’s Architects’ and Builders’ Price Book 2018 | July 2019 | |
| H&V operatives | Joint Conciliation Committee of the Heating, Ventilation and Domestic Engineering Industry | Craftsman: £12.46/hour | 2 October 2016 | Joint Conciliation Comittee of the Heating, Ventilation and Domestic Engineering Industry | A two-year agreement. Next review end of 2017 for October 2018 and 2019 |
| Electricians (national) | The Joint Industry Board for the Electrical Contracting Industry | Approved electrician: £15.92/hour (own transport) | 2 January 2017 | JIB for the Electrical Contracting Industry | A four-year agreement. Next review 2021 |
| Scottish Joint Industry Board for the Electrical Contracting Industry | Approved electrician: £15.92/hour (own transport) | 2 January 2017 | SJIB for the Electrical Contracting Industry | A four-year agreement. Next review 2021 |
Guide to data
Aecom’s cost indices track movements in the input costs of construction work in various sectors, incorporating national wage agreements and changes in materials prices as measured by government index series.
They are intended to provide an underlying indication of price changes and differential movements in the various work sectors but do not reflect changes in market conditions affecting profit and overheads provisions, site wage rates, bonuses or materials’ price discounts/premiums. Market conditions and commentary are outlined in Aecom’s quarterly Market Forecast (last published August 2017).


No comments yet