Labour costs continue to be the primary driver of building cost inflation in last year’s final quarter, with a mixed picture still for building materials
01 / Key changes
| Percentage change year-on-year (Q4 2014 to Q4 2015) | ||
|---|---|---|
| % | Direction | |
| Building cost index | +0.8 | ▲ |
| Mechanical cost index | +1.0 | ▲ |
| Electrical cost index | +1.3 | ▲ |
| Consumer prices index | +0.1 | ▲ |
(Q4 2015 figures are provisional)
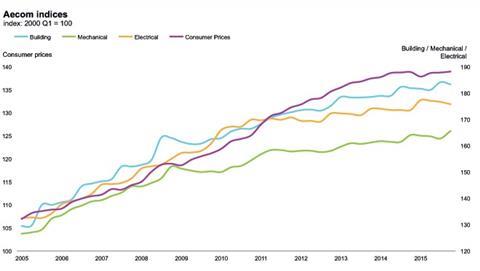
Building cost index
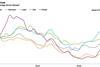
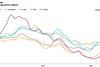
A composite measure of building costs increased over the last 12 months by 0.8% at Q4 2015. This is a slowing rate of increase, although labour costs continue to be the primary driver of building cost inflation, with a mixed picture still for building materials.
Mechanical cost index
The rate of annual change at Q4 2015 picked up slightly at 1.0%. This is a moderate increase from that recorded in the previous quarter. Despite continuing declines in the prices of metals commodities, labour cost inflation contributed most of the annual increase.
Electrical cost index
The electrical cost index increased by 1.3% over the year. This is a notably slower rate of annual change than those recorded earlier in 2015.
Consumer prices index
Consumer price inflation rate recorded negligible annual change at Q4 2015.
The chart below shows Aecom’s index series since 2005, reflecting cost movements in different sectors of the construction industry and consumer prices.
02 / Price adjustment formulae for construction contracts
Price Adjustment Formulae indices, compiled by the Building Cost Information Service (previously by the Department for Business Innovation & Skills), are designed for the calculation of increased costs on fluctuating or variation of price contracts. They provide guidance on cost changes in various trades and industry sectors – including labour, plant and materials – and on the differential movement of work sections in Spon’s Price Books. The 60 building work categories recorded an average decrease of 0.54% on a yearly basis. Higher rates of change were recorded in the following categories:
Price adjustment formulae
| February 2015 – February 2016 | % change |
|---|---|
| Finishes: flexible tiles and sheet coverings | 5 |
| Ironmongery | 3.8 |
| Finishes: plaster | 3.7 |
| Brickwork and blockwork | 3.4 |
| Finishes: painting and decorating | 3.1 |
| Pavings: slab and block | 2.9 |
| Windows and doors: plastic | 2.8 |
The largest price decreases include:
Price adjustment formulae
| February 2015 – February 2016 | % change |
|---|---|
| Concrete: reinforcement | -14.4 |
| Cladding and covering: copper | -9.5 |
| Pipes and accessories: copper | -9.3 |
| Metal: decking | -8.4 |
| Windows and doors: aluminium | -6.8 |
| Windows and doors: steel | -6 |
| Cladding and covering: lead | -4.9 |
Materials
03 / Summary
- Consumer price inflation measured as an average across Q4 2015 recorded negligible change at +0.1% versus the same time last year ▲
- Manufacturing input prices continue to fall, but the pace of declines slowed in Q4 2015 ▼
- Industry output prices remain negative on a yearly basis, although the annual rate of change moderated slightly in Q4 2015 ▼
- Commodity prices extend their negative price trends ▼
- Construction materials price inflation weakened in Q4 2015, extending a negative year-on-year trend to 14 months ▼
04 / Key indicators
Construction industry
The All Work material price index fell by 3.0% in the year to January 2016. Housing-related materials dropped by 1.7% over the last 12 months. Non-housing materials prices also fell over the year, declining by 3.4%. Mechanical and electrical services materials prices extended their slide too.
| Construction materials | % change | |
|---|---|---|
| January 2015 – January 2016* | ||
| New housing | -1.7 | ▼ |
| Non-housing new work | -3.4 | ▼ |
| Repair and maintenance | -3 | ▼ |
| Mechanical services materials | ||
| Housing only | -3.8 | ▼ |
| Non-housing | -3.7 | ▼ |
| Electrical services materials | -3.1 | ▼ |
*provisional
| % change | |
|---|---|
| January 2015 – January 2016 | |
| Ironmongery | 11.4 |
| Pre-cast concrete products: bricks, | |
| blocks, tiles and flagstones | 5 |
| Insulating materials (thermal or acoustic) | 4 |
| Pre-cast concrete products: generally | 3.2 |
| Builders woodwork: doors and windows | 3.1 |
| Ready-mixed concrete | 2 |
| Plastic pipes and fittings | -3.9 |
| Imported sawn or planed wood | -7.8 |
| Fabricated structural steel | -8.6 |
| Imported plywood | -11.1 |
| Concrete reinforcing bars | -24.6 |
*provisional Data sources: ONS and BIS
UK economy
| Consumer prices | % change | |
|---|---|---|
| January 2015 – January 2016 | ||
| Consumer Prices Index (CPI) | 0.3 | ▲ |
After languishing at or near 0 through 2015, the annual rate of consumer price inflation picked up at the start of 2016. Base effects are likely to have contributed to some of this rise, along with smaller falls in fuel prices compared to the same time last year. Forecasts for CPI remain below 1% over the near-term.
| Industry input costs | % change | |
|---|---|---|
| January 2015 – January 2016 | ||
| Materials and fuels purchased by manufacturing industry | -7.6 | ▼ |
| Materials and fuels purchased by manufacturing industry excluding food, beverages, tobacco and petroleum industries | -4.7 | ▼ |
Although input prices fell on a yearly basis up to January 2016, the annual rate of change slowed notably to -7.6% from an average of -12% during Q4 2015. Crude oil and imported metals led the declines by a significant margin. Core input inflation, which excludes volatile items, recorded -4.7% over the year.
| Industry output costs | % change | |
|---|---|---|
| January 2015 – January 2016 | ||
| Output prices of manufactured products | -1 | ▼ |
| Output prices of manufactured products excluding food, beverages, tobacco and petroleum | 0 | ► |
Factory gate prices declined further at -1.0% on a yearly basis, marking 19 consecutive months where prices fell. But the pace of falls slowed at January 2016, when -1.4% was recorded in December 2015. Again, it was petroleum-based products that contributed the largest movement in the annual rate. The core index, which is narrower because it excludes items such as petroleum and food, recorded no annual change in the year to January 2016.
Source: ONS
Metal prices
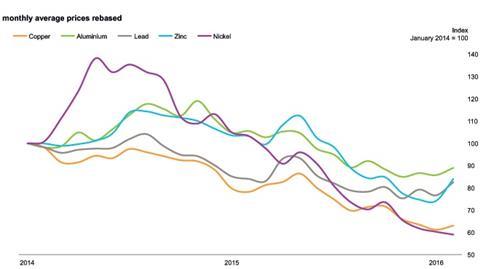
| % change February 2015 – February 2016 | ||
|---|---|---|
| Aluminium | -15.7 | ▼ |
| Copper | -19.4 | ▼ |
| Lead | -1.8 | ▼ |
| Zinc | -18.7 | ▼ |
| Nickel | -42.8 | ▼ |
Source: LME
Although still negative on a yearly change basis, the pace of price declines slowed through Q4 2015 and into the new year. Removal of some supply in major metals production halted the slide for prices, which began in late 2014. But price levels generally at Q4 2015 are still significantly lower than those seen at the start of the year such is the fall in prices. There is a view that price trends may have bottomed out, although an immediate bounce-back is not a high probability just yet. Efforts to curtail over-capacity across the globe for metals and other commodities may provide a floor for prices, as low prices will force out over-capacity in production, which should be one component in helping to move prices back up. In this sense, based on the laws of supply and demand, low prices may yet be the best cure for low prices. But what happens in the global economy will still act as a fundamental determinant of demand-side issues and corresponding price changes.
Exchange rates
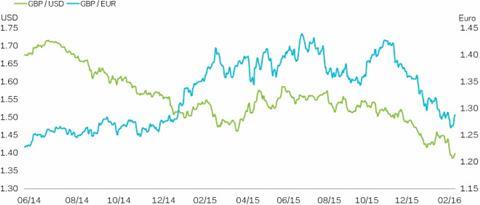
| Jan-15 | Jan-16 | % change | |
|---|---|---|---|
| GBP / EUR | 1.3018 | 1.3263 | 1.9 |
| GBP / USD | 1.5182 | 1.4412 | -5.1 |
After following divergent paths up to early 2015, the Euro and US dollar tracked a similar trend out of 2015 and into 2016. Much of the momentum behind sterling weakening against two of its major currencies pairs results from the pricing in of potential outcomes of the UK’s forthcoming EU referendum. Whatever the outcome, sterling is likely to be impacted in the lead up to and immediately after the referendum. Also likely compounding this trend has been a further market acknowledgement of the state of the UK’s finances and related structural issues, and additional strengthening of the US dollar after the Federal Reserve’s decision to increase its bank rate.
Labour
05 / Labour market statistics
- Average weekly earnings (total pay including bonuses) in construction rose to £601 in December 2015, from £598 a month earlier. Annually, total earnings increased 6.1% in December on a single-month basis, and 6.4% annually on a three-month average basis. Regular pay (excluding bonuses and arrears) increased to £574 per week, with annual rates of 6.2% on a single-month basis and 6.5% using a three-month average.
- Construction industry regular and total pay continued to far exceed changes to average earnings for the whole economy classification, according to Office for National Statistics (ONS) data.
06 / Wage agreements
Construction Industry Joint Council
The parties to the Construction Industry Joint Council agreed a pay deal which saw pay rates increase by 3% from 30 June 2014, and a further 3% rise from 29 June 2015. Travel and fare allowances also increased from 30 June 2014, along with subsistence allowances increasing to £35 a night from 6 January 2015. The agreement also addresses changes to sick pay.
Joint Council Committee of the Heating, Ventilating and Domestic Engineering Industry
A 3.0% increase in hourly wage rates came into effect from 5 October 2015. The daily travel allowance also increased by 3% from 5 October 2015. Amendments to the basic working week also applied from 6 October 2014, as the number of hours per week reduced from 38 to 37.5. Changes to the level of weekly sickness and accident benefit are also planned.
The Joint Industry Board for the Electrical Contracting Industry
Members received a 2% pay rise in January 2015, followed by a 3% increase from January 2016.
Building and Allied Trades Joint Industry Council
The Building and Allied Trades Joint Industrial Council (BATJIC) agreed a two-year pay deal effective from 30 June 2014. The deal involves variable wage rises averaging 2.5% for the standard wage rates. A further set of rises averaging 3% came into effect from 29 June 2015. Annual holiday entitlement increased by one day, as of 29 June 2015, from 21 days to 22 days, making a total of 30 days including public holidays.
The Joint Industry Board for Plumbing, Mechanical Engineering Services in England and Wales
A 2.50% increase in hourly rates came into effect from 4 January 2016. Employees rates of pay, allowances entitlements and benefits are published in promulgation No:171 of JIB for Plumbing, Mechanical Engineering Services in England and Wales agreement.
The BATJIC rates of wages effective from 29 June 2015 are:
| Standard rates of pay for 39 hours per week | Per week | Per hour |
|---|---|---|
| S/NVQ3: Advanced | £448.50 | £11.50 |
| S/NVQ2: Intermediate | £386.10 | £9.90 |
| Adult General Operative | £337.35 | £8.65 |
| For entrants aged 19 years and over | ||
| n Third 12 months with NVQ2 | £365.04 | £9.36 |
| n Third 12 months without NVQ | £317.85 | £8.15 |
| Apprentices under 19 years of age | ||
| n 18 years of age with NVQ2 | £300.30 | £7.70 |
| n 18 years of age without NVQ2 | £317.85 | £8.15 |
WAGE AGREEMENT SUMMARYThe following table summarises the wage agreements currently in force for the principal wage fixing bodies within the construction industry | |||||
|---|---|---|---|---|---|
| Operatives | Agreement body | Current basic hourly rate | Effective since | Details in | Date of next review |
| Builders and civil engineering operatives | Construction Industry Joint Council | Craft Rate: £11.33 / hour | 29-Jun-15 | Spon’s Architects’ and Builders’ Price Book 2016 | Jun-16 |
| Building and Allied Trades Joint Industrial Council (BATJIC) | S/NVQ3 Advanced Craft: £11.50 / hour | 26-Jun-15 | Spon’s Architects’ and Builders’ Price Book 2016 | Jun-16 | |
| Plumbers | The Joint Industry Board for Plumbing Mechanical Engineering Services in England and Wales | Advanced Plumber: £14.41 / hour | 04-Jan-16 | Spon’s Architects’ and Builders’ Price Book 2016 | 02-Jan-17 |
| Scottish and Northern Ireland Joint Industry Board for the Plumbing Industry | Advanced Plumber: £13.41 / hour | 06-Jul-15 | Spon’s Architects’ and Builders’ Price Book 2016 | A two-year agreement: Year 1 2015 = 2.5% Year 2 2016 = 2.0% | |
| H&V operatives | Joint Conciliation Committee of the Heating, Ventilating and Domestic Engineering Industry | Craftsman: £12.20 / hour | 05-Oct-15 | Joint Conciliation Committee of the Heating, Ventilating and Domestic Engineering Industry | 05-Oct-16 |
| Electricians (national) | The Joint Industry Board for the Electrical Contracting Industry | Approved electrician: £15.61 / hour (own transport) | 04-Jan-16 | JIB for the Electrical Contracting Industry | A two-year agreement: Year 1 2015 = 2% Year 2 2016 = 3% |
| Scottish Joint Industry Board for the Electrical Contracting Industry | Approved electrician: £15.61 / hour (own transport) | 04-Jan-16 | SJIB for the Electrical Contracting Industry | A two-year agreement: Year 1 2015 = 2% Year 2 2016 = 3% | |


No comments yet