The activity index is on the rise for second month in a row, according to the latest figures from Experian Economics, but orders remain in negative territory and the bad news just won’t go away in the jobs market
01 / THE STATE OF PLAY
The construction activity index increased by three points to 56 in November, remaining in positive territory for the second consecutive month, and at the highest level since January 2008. Across all sectors the activity indices were above the no-change mark of 50. The non-residential index saw the greatest rise - of two points to 56 - the highest level since February 2008. The residential activity index saw a marginal increase of one point to 51, while civil engineering remained unchanged at 57.
The orders index stayed at 49, indicating that orders continued to remain slightly below normal for the time of the year. Both the residential (41) and civil engineering (53) sectors saw their orders indices decrease by one and seven points respectively. However, the latter index remained in
positive territory for the second consecutive month. The non-residential orders index rose by four points to 63.
Responses to the survey question about activity constraints seem to be at variance with the rising levels of activity reported in November. The percentage of respondents reporting no constraint on activity (22%) decreased for the first time in six months. The proportion of firms reporting that insufficient demand was restricting their activity levels increased to 54%, the highest level since June of last year, while labour shortages became less of a concern as just 3% of businesses reported this as an issue.
Bad news continued in the jobs market as the employment index remained unchanged at 41. The index has now been below the no-change mark of 50 since January 2008.
02 / LEADING CONSTRUCTION ACTIVITY INDICATOR
![]()
![]()
CFR’s Leading Construction Activity Indicator is predicting a small slowdown in the rate of growth in December with the index dropping two points to 54. The beginning of the year is expected to see the index stay unchanged at this level before edging up by one point to 55 in February. The indicator uses a base level of 50: an index above that level indicates an increase in activity, below that level a decrease.
03 / MATERIAL COSTS
![]()
About 8% of residential and non-residential firms reported that material costs had fallen on an annual basis in November, which is down from the 12% reported three months ago. The majority of respondents (57%) indicated annual material cost inflation between 2.6% and 5%, an increase of 12% when compared with August 2012. Approximately a quarter of building firms (24%) reported annual material cost inflation of 7.5% or more.
During November, the trend of no civil engineering firms reporting annual material costs between 5.1% and 7.4% continued for the fourth consecutive quarter. Half of all respondents stated that material cost inflation had fallen on an annual basis, a big difference from August, when only a third of firms reported this.
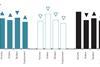
04 /REGIONAL PERSPECTIVE
![]()
Experian’s regional composite indices incorporate current activity levels, the state of order books and the number of tender enquiries received by contractors to provide a measure of the relative strength of each regional industry.
The indices for five regions increased in November, with the East Midlands seeing the greatest jump of eight points to 57, taking the region into positive territory. The South-west saw the second largest rise of five points to 53, taking the index above the no-change mark of 50 and to the highest level since June last year.
The South-east also saw an increase as its index went up by two points to 51, taking it into positive territory. Both the Yorkshire and Humberside (65) and Scotland (50) indices edged up by one point.
Northern Ireland saw the greatest fall as its index dived eight points to 33. The West Midlands saw its index decrease by five points to 38, while the North and North-west both saw their indices go down by two points to 38 and 40 respectively.
East Anglia (43) and Wales (45) followed behind, as their indices saw a marginal decline of one point.
The UK index, which includes firms working in five or more regions, saw an increase of three points to 56.
This an extract from the monthly Focus survey of construction activity undertaken by Experian Economics on behalf of the European Commission as part of its suite of harmonised EU business surveys. The full survey results and further information on Experian Economics’ forecasts and services can be obtained by calling 020-7746 8274 or logging on to www.experian.co.uk/economics.
The survey is conducted monthly among 800 firms throughout the UK and the analysis is broken down by size of firm, sector of the industry and region. The results are weighted to reflect the size of respondents. As well as the results published in this extract, all of the monthly topics are available by sector, region and size of firm. In addition, quarterly questions seek information on materials costs, labour costs and work-in-hand.


No comments yet