


Economic recovery and a strong pound seem to have seen a big move for the UK in EC Harris’ annual rankings
Produced with Langdon and Seah. Simon Rawlinson and Mark Williams analyse the results.
01 / Summary
The recovery of the UK’s construction industry has caused a big move for the UK up this year’s rankings. The strength of Sterling and the Euro and the return of construction price inflation in some of Europe’s traditionally high cost markets including Switzerland and Denmark have also had quite an effect on the results of the survey. Price inflation also affected the Hong Kong market, but it has moved down the cost rankings this year. The United States has seen some inflation during 2014, but this has been offset in the rankings by a weaker dollar.
A new feature this year is our assessment of the relative cost of central London projects aimed at the global market - reflecting London’s status as a world city. This does not include the highest cost levels associated with prime and super-prime residential developments, but even with those schemes excluded, Central London is the most expensive location to build in the sample. Cost levels are 30-40% higher than elsewhere in the UK due to very high levels of specification and difficult sites.
The devaluation of many emerging market currencies during 2013/14 means relative costs have fallen steeply in these places. Construction costs in India, Indonesia, Malaysia, Thailand and Vietnam are all less than 35% of typical UK levels when costs are compared on the basis of a common currency. Similarly relative costs in Japan have fallen to below the USA due to continued devaluation of the Yen.
With the exception of some European markets and locations such as Hong Kong, Qatar and Saudi Arabia, where specific market constraints are driving inflation, pricemovements have been subdued during 2013/14, aided by weak commodity prices and plentiful material supplies.
02 / Commodity price and currency trends
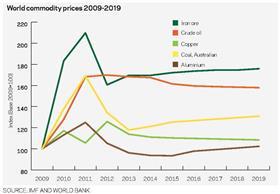
Commodity price trends
Commodity prices have fallen slightly during 2014, although increasing tension in the Middle East and Ukraine could potentially reverse this trend. Brent Crude is trading at around the same level as summer 2013, whilst natural gas prices have fallen by a remarkable 20% over the past 12 months. Whilst aluminium and nickel prices are up on the year, copper and steel prices are down. The most striking development during 2014 has been the fall in the price of iron ore, down by 35%.
A weaker Dollar has contributed to falling costs of commodities during 2014, and UK has seen copper prices fall by 8% in the past year - mainly as a result of currency fluctuation. By contrast, depreciation against the Dollar has hit emerging economies including Turkey, Indonesia and Malaysia hard - potentially leading to a substantial increase in costs of key construction materials. Recent price trends include:
- Coking coal prices are down by over 20% compared to the 2013 average. This is largely due to continuing expansion of production in China;
- Iron ore prices are down by 35% on the year to a two year low of US$87/tonne, triggered by slower growth in demand from China and a recent expansion in productive capacity;
- Brent Crude prices weakened during Q2 2014, even as inventories fell and political tensions rose. This trend has been driven by investor behaviour rather than supply/demand dynamics;
- Nickel prices have fluctuated wildly due to a ban by Indonesia of the export of unrefined ore. This triggered a wave of speculative investment, and whilst prices have moderated to around US$18,000/tonne they remain 35% up on a year ago;
Forecasting over a longer timescale, the World Bank currently anticipates that prices will remain steady over the next 5 years - reflecting stable economic growth and higher levels of production.
Currency trends
Currencies have had another turbulent year. The recovery of some developed economies has coincided with weakness in emerging market countries such as Indonesia and Turkey. Sterling has been strong in all markets, which is good for importing industries such as construction. This strength is a major factor in the UK’s shift in the rankings. Against the dollar, European currencies including sterling, the zloty and the euro have all strengthened. By contrast, Indonesia’s rupiah has lost 27% of its value and the Turkish lira has lost 22% - in both cases related to large deficits and capital flight. After appreciating against western currencies in 2013, the yuan has slipped back in 2014 by 12% in the case of sterling. The the value of the yen has also continued to fall - particularly against sterling and the euro.
03 / Europe
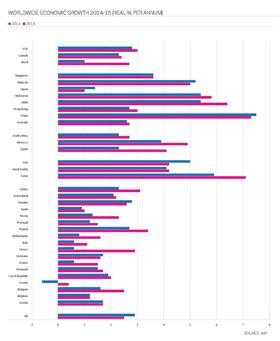
While optimism about the prospects of the Eurozone has improved, poor results for a number of key countries in Q2 have underlined the fragility of the recovery. The European commission forecasts growth of 1.2% in 2014, but with no growth in Q2, and growing risks associated with the impact of sanctions against Russia, the outlook for the year is less certain. Encouragingly, all Eurozone countries are forecast to return to growth during 2014 - even the peripheral economies most affected by the 2008 downturn. The UK, Scandinavia and eastern European states such as Poland are forecast to grow at rates of around 3%, whereas France and Spain will bump along at around 1%. Of great concern is Italy which re-entered recession in Q2 after contracting by 0.8%. The recovery in the European economy has been accompanied by an improvement in prospects for construction markets. However, few markets will see growth at the 4%+ levels forecast for the UK. Overall construction in the Eurozone is expected to grow by about 1.3% this year. There are some bright spots such as Ireland, which expects construction growth of nearly 10% in 2014. In 2015 and 2016, overall growth in construction will increase to around 2%, with Denmark, Ireland, the Netherlands, Poland and the UK expected to be strong performers.

Germany
Germany’s economy is the powerhouse of Europe, so the shock 0.6% fall in GDP in Q2 could have wider implications for growth and confidence. Germany’s strengths continue to be high employment, low borrowing costs and a balanced budget. However, its exposure to sanctions against Russia and to international export markets could have a deeper impact later in the year. Low levels of investment are holding back recovery in construction. Germany’s construction industry grew by 0.2% in 2013, and is forecast to grow by 2.9% this year. Industry is expected to benefit from a €23bn infrastructure programme after the 2013 election, focused on improving road networks. The housing sector, which accounts for 50% of construction expenditure, continues to benefit from a shift from renting to purchasing, but with the value of housing loans increasing by only 1% in 2013, marlet conditions are quite stable. Looking further ahead, population growth will underpin growth in the residential sector. In the commercial sector, cities including Munich and Hamburg are regularly named as the best places in Europe for property investors, sustaining workload for both new-build and refurbished offices.
France
The economy continues to be held back by significant headwinds. Growth of GDP of 0.6% is forecast for 2014, and with a budget deficit of 4%, government has few options to invest in stimulus initiatives - shown by the small scale of a €3.6bn road investment programme introduced in 2014. Construction is forecast to shrink by 1.2% in 2014 and could flat-line in 2015. There is some large scale infrastructure investment, often funded by PPP, including two motorway concessions with a total spend of nearly €2bn. These highway projects form part of a wider programme worth around €32bn which is planned to be let between 2012 and 2020. In contrast to encouraging signs from the infrastructure sector, housing construction looks less positive. Poor availability of finance and low price inflation are holding back investment in both rental and for-sale. Housing starts fell by nearly 15% in 2013 to 342,000 - well below the target set by government. Despite weak growth, construction prices have been rising, although the inflation rate has fallen to 0.6% over the past year.
Poland
Poland avoided recession during the downturn and is currently forecasting growth of 2.7% for 2014, accelerating to 3.4% in 2015. Despite this, the local construction industry has endured two difficult years as the next round of part-EU funded infrastructure projects move through procurement and design. Poland’s share of funding could eventually exceed €100bn, and infrastructure construction will be a major beneficiary. The commercial sector is set to benefit from Poland’s economic strength - particularly in retail. The residential sector is still recovering from bubble conditions that peaked in 2008. The number of residential starts has fallen by 11.2% in 2014. However, a government-funded programme to support first time buyers could spark a revival in the market.
Spain and Italy
Spain and Italy remain in the top five European construction markets, but have contracted continuously since 2008 - Italy by 15%, and Spain by an astonishing 50%. Italy’s economy ground to a halt in early 2014, and has been very weak since early 2012. A weak recovery is forecast from 2014, but forward-looking indicators suggest further contraction. Spain is showing signs of recovery, albeit from an extremely low base. Investment interest in Spanish commercial property has been high recently - partly because property values are so low, and because supply conditions are increasingly favourable. Domestic demand in Spain is expected to remain low due to high unemployment and low wage growth. Construction, as a result, is likely to be focused on commercial property, export industries and the tourism sector, boosted by a wider Eurozone recovery.
Netherlands
The Netherlands construction industry has endured three years of contraction but is on course to expand by around 4%-5% per annum from 2015 onwards. Areas where growth is anticipated include the residential sector, ports, logistics and potentially the industrial sector in response to a broader European recovery. As a result of the downturn and overall slack in the Dutch economy, it is not expected that resource constraints will accompany the recovery and price inflation will remain subdued.
04 / Americas
Many of the trends seen in the Americas in 2013 have been sustained into 2014, including a robust housing recovery and the continuation of a shale gas, unconventional oil and minerals boom in the USA and Canada. Two major trends affecting construction markets are the re-industrialisation of the United States, and the re-invigoration of many city centres. Re-industrialisation is being driven by the reduced gap in production costs between the US and Asia, and the desire by many manufacturers to shorten supply chains. Re-urbanisation is being driven by commercial and residential development, with workers and residents preferring to be located centrally.
United States
After a strong performance in 2012, when most construction sectors saw robust growth, 2013/14 has seen more stable market conditions. Expenditure on non-residential buildings and infrastructure construction fell by about 2-3% during the year. By contrast, residential construction grew by 19% to total US$336bn. Although this level of activity still represents only 50% of the output recorded at the peak of the market in 2006, it is widely thought that the increase in house building seen in 2012/13 represents the peak of the current cycle. Positive developments during the year include a broadening recovery of the commercial real estate market, which is spreading from major centres such as San Francisco, New York and Dallas/Fort Worth to a wider range of 20 or 30 cities.
The outlook for the public sector is also positive, albeit that spending levels will remain tightly constrained throughout the Obama presidency, and will be subject to short-term fixes rather than long-term solutions. The scale of the opportunity for construction has been highlighted by the publication by the American Society of Civil Engineers (ASCE) of its four-yearly assessment of the condition of the US’s infrastructure - rating most assets at grade D or worse. The ASCE claims that US$3.6tn will need to be spent on upgrading existing infrastructure between now and 2020 - equivalent to four years total construction spend. As more than 90% of public spending is undertaken by heavily indebted states and local governments, this level of investment is unlikely to be financeable. However, dealing with the legacy of a decaying infrastructure base will sustain construction workload over time. Beyond buildings, spending on energy infrastructure remains high, focused particularly on investment in pipelines and other transport infrastructure.
Canada
Canada has been one of the strongest construction markets in the Americas for many years - with growth being sustained by a booming housing market and high levels of investment in energy infrastructure. 2013 saw a bit of a blip, with growth falling to just over 1%. Output is expected to expand by 2% in 2014 before returning to the 4% per annum trend from 2015 onwards. Sources of growth include the New Building Canada Plan, announced in February 2014, which has earmarked US$49bn for national and municipal investment. Canada currently has a pipeline of US$70bn of infrastructure projects in the pre-procurement pipeline, with investment in rail and energy generation and transmission having particularly strong prospects. While activity levels in the oil and minerals sectors are currently very high, the timing of future investments could be affected by fluctuations in commodity prices and by a challenging regulatory environment.
The Canadian Central Bank took steps in 2012/13 to cool the booming housing market by placing restrictions on lending. Housing starts fell during 2013 but recovered briefly in early 2014. With mortgage rates rising, it appears that the residential market is heading towards a soft landing.

Brazil
Brazil’s economy stagnated during 2013 and 2014. GDP growth is currently forecast to be no higher than 1% in 2014. With inflation running at 6.5%, and industrial production down by 7% compared to the previous year, the economy does face some significant headwinds. Construction markets have been at a crossroads, with the successful PAC2 state-funded infrastructure programme coming to an end in 2014, and with the focus of residential development shifting to the lower end of the market that is dependent on subsidised mortgages.
Prospects for construction are improving due to the successful conclusion of a number of high value PPP deals in the past 12 months, worth about US$80-100bn, underwritten by subsidised loans from the State Bank - BNDES. However, as the Brazilian PPP market has not yet been successful in attracting institutional funding, rates of growth in output of 3-4% may not be sustainable. One positive development in construction has been a moderation of inflation, which prior to 2012 had been running at over 8%. With construction inflation running at 3-4% per annum for the past 2 years, costs have effectively been falling in real terms, helping to make the industry much more competitive.
05 / Gulf and Middle East
Despite increasing instability in the wider Middle East, three trends are having a positive influence on levels of construction spend in the Gulf Region. The first is the continuation of high levels of investment on social infrastructure to meet the needs of a rapidly growing population. The second is investment in economic diversification, exemplified by ambitious plans for transport investment such as the US$200bn Gulf Cooperation Council (GCC) rail network. The third is event-driven construction, and with Dubai securing the 2020 World Expo on top of Qatar’s World Cup success, this is a trend that can only strengthen over the next few years.
Saudi Arabia
Saudi Arabia is the GCC’s largest construction market, with an annual output of around US$35bn. Activity is expected to grow at about 8-10% for the next few years, driven by investment in housing, social infrastructure, transport and energy generation. Housing provision remains a huge challenge due to rapid population growth, and Saudi Arabia must build at least 300,000 dwellings a year just to keep up with this growth rate. The speed at which Saudi Arabia’s estimated US$1tn investment pipeline is being converted into actual work is accelerating. Contract awards grew by 25% in 2013, and construction work has started on mega-projects such as the US$20bn Riyadh Metro and the Kingdom Tower. This has created the potential for resource constraint that can already be seen in cement supplies, and particularly in connection with construction labour.
The 2013 introduction of the Nitaqat programme for the Saudisation of employment has caused big problems, with an estimated US$25bn of projects being disrupted due to labour shortages. The Saudi government has acted to mitigate some of the effects of Nitaqat, but there are likely to be long term impacts on cost levels in the industry, as Saudi workers have much higher earnings expectations than the migrant workers which they are displacing.

United Arab Emirates
The UAE has seen its recovery from the 2008 crash consolidate over the past two years, and GDP is expected to grow by 5% this year. In some ways the UAE has been an unexpected beneficiary of wider global instability, with many investors turning to Dubai as a safe haven - house prices increased by 30% in the past 12 months. The most recent data shows that construction grew by nearly 4% in 2013, and with US$12bn of stalled construction projects being brought out of mothballs, as well as many new schemes starting, the prospects for further medium term growth are good. The award of the World Expo to Dubai will trigger US$3-4bn of direct investment and a much larger programme of transport infrastructure and commercial development. The UAE is a large construction market which relies on expatriate and imported materials resources. Inflationary risks are increasing as the UAE competes with other GCC markets for these key resources.
Qatar
Qatar has a relatively small construction industry with output at around US$9bn. Historically, Qatar’s rate of growth has been steady, but this is changing rapidly as the delivery of the 2030 National Plan and the 2022 World Cup has accelerated. Some non-critical elements of the National Plan have been deferred, and with the exception of retail schemes, private developers are waiting until publicly-funded infrastructure is in place before committing to their own construction programmes.
Following a slow start to the procurement of many programmes, local supply chains which had been built-up in anticipation of plentiful workload are now beginning to feel the pressure. With the revival of the UAE construction market for example, the competition for construction professionals has become even more intense. Where the Qatari Government is able to intervene in markets, such as the sourcing of bulk materials, it is being increasingly pro-active in the steps taken to mitigate both supply and pricing risks.
06 / Asia
China’s gradual economic shift towards a consumption-based model means that the growth seen in construction over the past 10 years is unlikely to be sustained in the long term. Elsewhere in Asia, construction markets had another strong year in 2013, particularly in Japan, where the stimulus associated with one of the three “arrows” of Abenomics (policies advocated by prime minister Shinzō Abe since the 2012 election) has had a significant impact on construction markets. Hong Kong and Singapore also saw strong growth in 2013 driven by a combination of strong residential markets and high levels of infrastructure spend. Elsewhere, members of the “next 11”, including Malaysia, Indonesia and the Philippines, may find that the delivery of their ambitious investment programmes become more challenging as fluctuations in commodity and currency markets and wider economic trends affect their ability to fund projects or attract hard currency PPP investment.
China
China reset its GDP growth trajectory to 7.5% pa in 2013, and as a result rates of growth in construction have started to ease. In particular there have been increasing signs in 2014 that the booming housing market may have peaked - a recent survey showed that prices have been falling in 64 out of 70 major cities. Such is the need for critical infrastructure outlined in the current 5 Year Plan that overall the construction industry will continue to grow, and China will remain the dominant global construction market.
Trends seen over the last couple of years, such as the greater focus by developers on the affordable end of the residential market, and an increased effort to ensure the long term sustainability of retail and mixed use development through good quality design and active management of the tenant mix and asset will become more important as markets become more challenging - particularly as the risk of oversupply in some markets grows. However, the ability of the Chinese market to absorb capacity given rapid growth of the population and growing rates of urbanisation should not be under-estimated. Construction costs are up by about 1% over the past year - the first increase since mid-2012. Excess manufacturing capacity and weak commodity prices have helped to keep material costs low, which has compensated for labour costs which continue to increase at 7-8% pa.
Hong Kong
Hong Kong enjoyed a strong 2013, with GDP growing by 2.9% in real terms, buoyed by high levels of tourism from mainland China and healthy global trade. GDP is expected to grow at a more moderate 2.4% in 2014. Based on latest data from the first quarter of 2014, activity levels in construction may actually be increasing at a slightly faster rate for 2014 compared to 2013 - at around 5%. The recent increase in construction activity in Hong Kong is being driven mainly by residential development - which accounts for 35% of new build, and public spending on transport, which accounted for 80% of new build infrastructure work in 2013. There are some interesting shifts in the residential market, with developers targeting schemes with smaller units aimed at the volume market, and with the government struggling to make good its pledge of delivering 20,000 private units per annum with only 9,000 consents given during 2013. High volumes of construction have resulted in local skill shortages and average wage rates have increased by 8% over the year. Some trades have secured wage hikes of up to 18%. Materials costs have remained flat however, and as a result, whilst tender price inflation continues to increase, the rate of growth has fallen to 5-6%

Singapore
Construction output grew by over 7% during 2013, with the industrial and institutional sectors being particularly strong. The residential sector had a buoyant year in 2013, but after steps were taken to cool down the investment market, public sector housing will become the growth sector driven by an US$8bn programme. Singapore is benefitting from its proximity to Malaysia, and a number of mixed-use commercial schemes in the territory are a product of joint venture investments. Infrastructure projects typically account for around 25% of construction spend in Singapore and a 15 year plan has recently been outlined, including metro, rail and highway programmes. Whilst these programmes are not expected to significantly boost the construction sector, they will underpin steady growth. Despite continuing growth in activity, price movements are relatively steady. After growing by 6% in 2013, prices are up by 1% year on year in 2014 - reflecting some moderate labour shortages.
Details of the survey
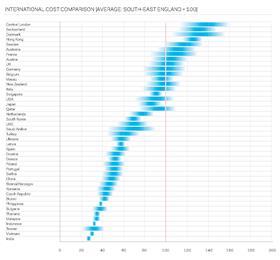
The comparative cost assessment is based on a survey of construction costs in 43 locations undertaken by EC Harris and Langdon and Seah, covering 13 building types. Costs are representative of the local specification used to meet market need. The building solutions adopted in each location are similar and as a result, the cost differential reported represents differences in specification as well as the cost of labour and materials - rather than significant differences in building function. Costs in local currencies have been converted into a common currency for the purpose of the comparison, but no account has been taken of purchase power parity. Currency conversions are calculated on the basis of average rates during June-August 2014. High and low cost factors for each building type have been calculated relative to the UK, where average costs for South-east England = 100. The relative costs plotted in the chart represent the average high and low cost factor for each of the 13 buildings included in the sample.
Acknowledgments
We would like to thank Constance Lau of Langdon and Seah and Michael Richards of EC Harris for their assistance in the production of this article, as well as our correspondents in 43 locations who contributed cost data and market intelligence.


No comments yet