The total activity index indicated growth, while R&M index rose for the fifth consecutive month. However the picture was mixed, with residential and non-residential activity taking a hit.
01 / State of play
The total activity index for November continued to indicate growth in the sector at 54 points, but has decreased for a second consecutive month (down from 60 in September and August). The R&M index, however, was up by five points on October’s figures at 59, marking the fifth month of R&M activity growth.
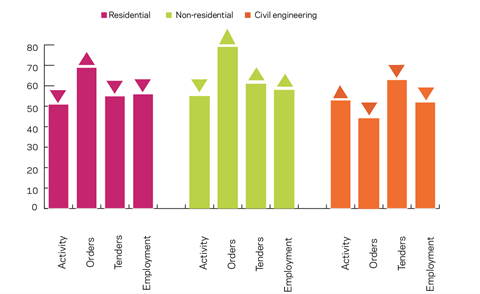
Both residential and non-residential activity remained in positive territory. However, their indices fell closer in line with the no-growth bound of 50 points. The residential activity index dropped seven points to stand at 51, while the non-residential activity index stood slightly higher at 55, four points down on October. Civil engineering activity returned to positive territory, recovering by eight points to 53, , eight points up from the preceding month.
The figures suggested continuing favourable developments in orders and tender enquiries. The index for orders stood at 68, up five points on October and the tender enquiries index was unchanged.
Orders in the residential and non-residential sector remained robust in November, as their indices reached 69 and 79, respectively (64 and 70 in October). Civil engineering lost 18 points and fell to 44, the same level as a year earlier.
The tender enquiries indices for the residential and civil engineering sectors showed further deceleration in growth, with the residential index down two points to 55 and the civil engineering index falling by five to stand at 63. The non-residential tender index ticked up a point to 61, the same as in September.
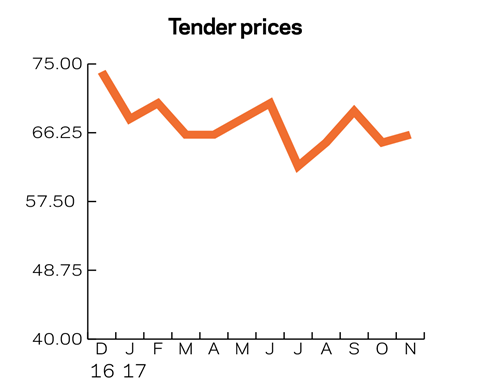
The tender prices index ticked up by one point to 66. The index remained firmly on the expansionary side, with October marking the 16th month of a level above 60 points.
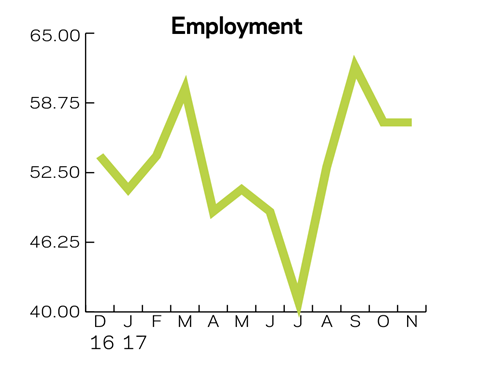
Employment prospects marked a fourth month of growth, remaining unchanged at 57 points. The posted figure was the third highest (along with the previous month) of 2017.
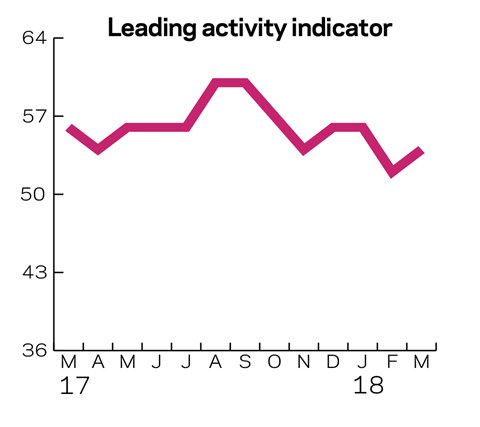
02 / Leading construction activity indicator
The latest activity index continued to suggest positive developments in contractors’ workloads, despite the continued loss of points.The index stood at 54 in November, down by three points on October’s figures and at the same level as in April. In the next four months, the indicator is expected to remain within positive territory as it initially gains momentum then loses some of it to return to its current level.
03 / Material costs
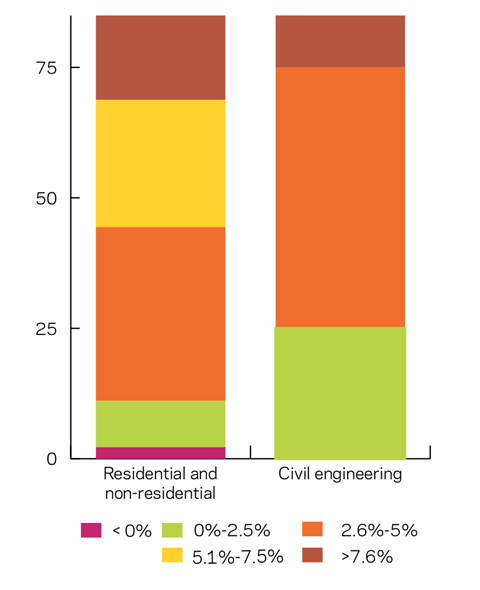
Inflationary pressures continue to affect material costs, with the rate reaching a three-year high in November. The results from the latest survey indicated that 98% of respondents in the residential and non-residential sector saw increasing material costs (94% in September), albeit with more divergence in the stated cost increases. One-third of respondents cited price growth between 2.6% and 5%, which is slightly lower than in September. However, 24% of respondents experienced a rise of between 5% and 7.4%, 11 percentage points up from September. The share of agents who have indicated a rise in material costs of more than 7.5% has fallen slightly to 31%.
In the civil sector, all respondents faced rising material costs, as in September. Half of respondents in the sector estimated that material costs increased between 2.6% and 5%. The other half of the respondents were split equally in groups citing either an increase of up to 2.5% or more than 7.5%. November’s picture is quite different from the one in September, when all respondents estimated rising costs of more than 5.1%.
04 / Regional perspectives
Experian’s regional composite indices incorporate current activity levels, the state of order books and the level of tender enquiries received by contractors to provide a measure of the relative strength of each regional industry.
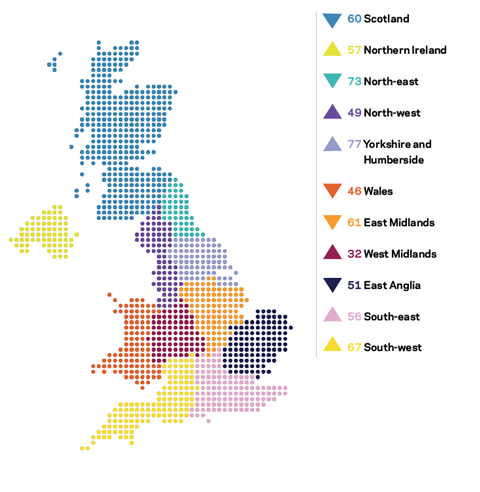
In November, the composite index continued to fall, standing at 63 as a third region dropped below the no-growth zone.
Wales lost four points on October’s figures to stand at 46 in November. The West Midlands and North-west gained a point each, but remained below the no-growth bound at 32 and 49 respectively.
Four other regions in positive territory saw a decline in respective indices: the East Midlands dropped furthest, with a loss of eight points, to stand at 61, followed by the North-east, which lost its leading position by dropping six points to 73. East Anglia and Scotland also saw a slow-down in activity.
Yorkshire and Humberside marked the month’s largest rise, with an 11-point increase to 77.
The UK composite index lost five more points from October’s figures but remained within positive territory at 63 points. November marked the third month of UK composite index above 60 points.
This an extract from the monthly Focus survey of construction activity undertaken by Experian Economics on behalf of the European Commission as part of its suite of harmonised EU business surveys.
The full survey results and further information on Experian Economics’ forecasts and services can be obtained by calling 0207-746 8217 or logging on to www.experian.co.uk/economics
The survey is conducted monthly among 800 firms throughout the UK and the analysis is broken down by size of firm, sector of the industry and region. The results are weighted to reflect the size of respondents. As well as the results published in this extract, all of the monthly topics are available by sector, region and size of firm. In addition, quarterly questions seek information on materials costs, labour costs and work-in-hand.


No comments yet