In this quarter’s analysis of construction materials and labour prices, Davis Langdon reports on the double whammy of electrical costs and electricians’ pay deal that is making it pricey to get the sparks flying …
Key trends
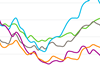
- Oil prices, energy prices, steel prices and non-ferrous metal prices underpin significant cost increases faced by industry in general and the construction market in particular.
- Labour shortages continue to drive up both site labour rates and national agreement rates.
Electrical costs have continued to head the inflation table, rising 8.7% over the 12 months to the fourth quarter 2004. Materials for electrical installations have risen 9.5% over this period, the highest annual inflation rate since October 1995. This was compounded by the highest sector labour increase, with the cost of employing an electrical gang increasing 8.4% over the year. The rise in labour costs in 2005 is expected to be a lower 5.3%.
Building materials costs and mechanical services materials costs also rose last year at record levels, increasing 7.1% and 8.3% respectively, driving all the cost index series up. The cost of employing a heating and ventilating gang rose 4.4%, and the cost of employing building operatives rose by 7.2%.
Although consumer prices continue to rise at a rate below the government’s target, building contractors and construction clients are faced with cost increases more than five times higher.
Guide to data
Davis Langdon’s cost index series track movements in the input costs of construction work, incorporating national wage agreements and changes in materials prices as measured by government index series. They provide an indication of price changes and movements in various work sectors, but do not reflect changes in market conditions affecting profit and overheads provisions, site wage rates, bonuses and price discounts/premiums.
Market conditions are recorded in Davis Langdon’s quarterly Market Forecast (last published 4 February).
Price adjustment formulae for construction contracts
Price adjustment formula indices, compiled by the DTI and ONS, are designed for the calculation of increased costs on fluctuating or variation of price contracts. They provide guidance on cost changes in various trade and industry sectors and on the differential movement of work sections in Spon’s Price Books.
Of the 60 categories, those displaying the highest inflation over the past six months are shown below:
% change July 2004-Jan 2005
Windows and doors: Steel +15.3
Metal: Decking +9.3
Piling: Steel +7.7
Metal: Miscellaneous +7.6
Cladding and covering: Coated steel +7.5
Cladding and covering: Lead +5.7
Pipes and accessories: Steel +5.1
Pipes and accessories: Spun and cast iron +4.8
Pipes and accessories: Plastics +4.1
Raised access floors +4.0
In addition, concrete reinforcement, bitumen, resin and rubber latex flooring, insulation, fencing, copper pipes and aluminium pipes have all increased in price in excess of 3% over the past six months.
Seven of the 10 items above relate to the rise in steel prices that dominated inflation trends last year.
But nine work categories show a fall in costs since last July, of which the most significant are:
Filling: Imported, hardcore and granular –7.1
Waterproofing: Liquid applied coatings –2.3
Softwood carcassing and structural members –1.8
Windows and doors: Softwood –1.7
Concrete: Formwork –1.6
The last three items relate to an easing in timber prices: imported wood prices fell by 6% between November 2003 and October 2004 but have since partially recovered.
The above figures do not illustrate what has happened to structural steelwork over the past year as this is covered by a separate formula. The index for structural steelwork materials shows a rise of 48% between April and December 2004 and an increase of 60% over the year to December.
Materials
Unabating hikes in energy prices are still driving consumer inflation and manufacturing costs – which all means that construction output prices are through the roof
Key trends
? Rising energy costs drive consumer inflation
? Manufacturing input prices rise at fastest rate for nearly 10 years
? Crude oil prices breach the $50-a-barrel mark again
? Energy prices also drive industry costs up
? Industry output prices are at an eight-year high
? Construction materials prices for housing fairly stable but other materials prices continue to rise
?The rate of increase for building materials decreased in the latter half of last year
? Electrical materials price rises accelerated
Key indicators
% change Direction of (Jan 2004-Jan 2005) change
Consumer prices
Consumer Prices Index (CPI) +1.6 ?
Industry generally
Materials and fuels purchased by manufacturing industry +9.5 ?
Materials and fuels purchased by manufacturing industry excluding food, beverages, tobacco and petroleum industries +7.2 ?
Output prices of manufactured products +2.6 ?
Output prices of manufactured products excluding food, beverages, tobacco and petroleum +2.5 ?
The Consumer Prices Index fell by 0.5% in January from its December level. However, this is a normal seasonal movement rather than an indication of a falling trend. Over the year the rate of increase has edged up to 1.6%, a rate not exceeded since December 2002. Rising energy costs have been the main reason for this hike – and the rate is expected to rise further towards the government’s target figure of 2% as higher gas and electricity prices continue to feed into the index.
Nevertheless, UK consumer inflation remains among the lowest in Europe with only Finland, Sweden, Denmark and the Netherlands having lower inflation.
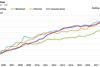
Manufacturing input prices are rising at their fastest rate for nearly five years. The cost of materials and fuels purchased rose by 9.5% over the last year, the highest annual figure since October 2000. Prices leapt 3.4% between December and January alone, largely as a result of another surge in crude oil prices but also because of increased costs of imported parts and equipment. Crude oil prices have risen 40.9% over the year to January, including a 14.8% leap between December and January.
Excluding the food, beverages, tobacco and petroleum industries, manufacturers’ input prices still rose by 7.2% over the year, the highest figure recorded since September 1995. The monthly increase recorded in January was 1.9%, the largest monthly rise since January 1995.
The principal commodities driving the input price rises over the last year have been:
electricity +18.8%
gas +18.1%
crude oils +40.9%
imported metals +15.8%
plastics in primary forms +19.7%
Counter to the trend of industry’s input costs, the rate of increase of output prices is actually declining. Slight falls in the index for output prices for all manufactured products in December and January caused the annual rate of increase to slow from 3.5% in October and November to 2.6% in January. The price of petroleum products has provided the greatest contribution to output price inflation over the past year but a fall in petroleum prices in January also caused the latest easing in the rate of inflation.
However, output prices excluding food, beverages, tobacco and petroleum products also peaked last November at an only slightly lower 3% and has since eased to 2.5%. This remains the highest level of output price inflation since April 1996.
The primary drivers behind this high level of inflation over the year to January are:
base metals +22.7%
fabricated metal products +8.7%
recovered secondary raw materials +8.9%
Prices for the last category have actually fallen 17% since November, illustrating the continued volatility of this sector.
Construction materials
Construction materials Dec 03-Dec 04
Non-housing new work +10.8 ?
New housing +3.3 ?
Repair and maintenance +4.5 ?
Mechanical services materials
Non-housing +8.1 ?
Housing only +11.2 ?
Electrical services materials +10.2 ?
Construction materials prices for new non-housing work continued to rise throughout last year – although three-quarters of the increase noted above occurred in the first half of 2004: prices rose just 2.7% in the second half. The cost of new housing materials have not maintained the same upward momentum: prices have remained fairly static for the past six months.
The sector experiencing the most sharply rising materials costs is now electrical services: in the first half of last year prices rose 3.6%, but in the second half this accelerated to 6.3%.
The nature of the rises indicated above suggest that the principal causes of material price inflation involve steel and other metals prices, rather than materials more usually used in housing.
ONS figures identify the following significant materials price changes in the nine months since April 2004:
% change April 04–Jan 05
Stone for construction +12.9
Steel tubes and fittings +12.5
Plastics in primary forms +9.2
Lighting equipment and electric lamps +9.2
Central heating radiators and boilers +7.6
Aluminium bars, rods and profiles +6.7
Glass fibres +6.2
Ready-mixed concrete +5.9
Taps and valves +5.2
Sawn wood +4.7
Veneer sheets: plywood etc +4.5
Coated roadstone –3.1
Kitchen furniture –5.0
Crushed rock –8.7
(Data sources: ONS and DTI (Dec 2004 and Jan 2005 figures provisional)
The above figures do not fully include some price increases that have occurred since the beginning of the year, namely :
Cement +15%
Sand and gravel +£1/tonne
Ready-mixed concrete +£5/m3
Asphalt products +£3.50-4.50/tonne
Insulation products +6-8%
Labour
English and Welsh plumbers are whistling a happy tune with a 6% pay increase, and electricians in England and Scotland are now enjoying the first phase of their three-year deal
Key trends
? New wage award for plumbers – up 6%
? lso for electricians – up 3.7% outside of London and up to 6.2% in the capital
? Builders look forward to a 9.5% rise at the end of June
? Plumbers and plasterers remain the most difficult trades to recruit
? raft workers in local authorities have had to accept just 8.9% over three years.
Plumbers and electricians
Plumbers
Plumbers in England and Wales received an increase in wages from 3 January which formed the second and final part of a two-year agreement. Basic hourly rates of pay for operatives, apprentices and adult trainees rose 6% but allowances remained unchanged or rose at a reduced rate. Details were provided in Cost Update, 3 December 2004.
Wage rates for plumbers in Scotland and Northern Ireland have been in force since 22 March 2004 but will not change until 30 May 2005, when basic rates will rise 5-6.6% depending on grade.
Electricians
In July 2004 the Joint Industry Board for the Electrical Contracting Industry promulgated an “industrial determination” of three years’ duration. The first part introduced an increase in wage rates from 10 January 2005. National Standard Rates increased 3.7% across the board but the increase in London rates varied between 2.8% and 6.2%, depending on grade.
A technician with own transport received the highest increase, the basic rate rising from £13.62 to £14.46 per hour, the percentage increase declining with experience or seniority.
The new rates are shown in the table 'Electricians’ hourly pay rates (£ per hour)'.
Daily travel allowances and daily travelling time payments outside of London have similarly risen 3.7%, and London rates have gone up 4.5%. This has introduced a differential for the first time in travel allowances inside and outside of London.
National standard rates for apprentices have also risen 3.7% across the board, and London apprentice rates have risen a variable 0.5-7.4% dependent on grade and transport provision.
Scotland
The Scottish Joint Industry Board for the Electrical Contracting Industry have had parallel wage settlements in place since 2001. They currently have a three-year wage agreement in place that mirrors the National Standard Own Transport rates detailed above for operatives who make their own way to site and start and finish at the normal times.
Operatives who book on and off at the employer’s shop are paid a Shop Rate, which is the equivalent of the JIB’s rates for operatives employed permanently at the shop and is about 7.5% lower than the Transport Provided rates detailed in the table 'Electricians’ hourly pay rates (£ per hour)' .
Travel time payments and travel allowances are the same as the JIB’s National Standard rates. The wage increase that came into effect on 10 January amounts to a rise of 3.7% on all rates and allowances.
Downloads
Key trends in construction prices
Other, Size 0 kb


No comments yet