Construction input costs are down and output prices are flat, while some workers have negotiated small wages increases for 2013
01 / KEY CHANGES
- All construction cost measures in decline
- Consumer price inflation returns to upward trend
- Industry input costs lower; output prices flat
- Most building cost categories showing little movement
- Oil based materials have shown some upward price change
- Steel prices have fallen over the year
- Most wage rates frozen for 2012 but small increases secured by builders and electricians for January 2013.
The following chart shows how Davis Langdon’s index series, reflecting cost movements in different sectors of the construction industry, have fared since 2000, with the movement of the Consumer Prices Index for comparison.
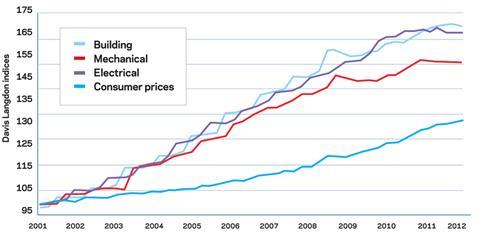
Building cost index
Materials prices fall during the summer and wage rates remain frozen resulting in lowest year on year increase since the end of 2009
Mechanical cost index
Mechanical costs last lower in first quarter 2011 as wage rates remain frozen for two years and materials prices slowly unwind from substantial increases in early 2011
Electrical cost index
Electrical costs fall in the third quarter of 2012 to their lowest level in eleven quarters as wage rates remain frozen for three years
Consumer prices index
Consumer price inflation fell to 2.2% in September, its lowest figure since November 2009, but rose to 2.7% in October largely in response to the rise in university tuition fees.
02 / PRICE ADJUSTMENT FORMULAE FOR CONSTRUCTION CONTRACTS
Price Adjustment Formulae indices, compiled by the Building Cost Information Service (previously by the Department for Business Innovation & Skills), are designed for the calculation of increased costs on fluctuating or variation of price contracts. They provide useful guidance on cost changes in various trades and industry sectors and on the differential movement of work sections in Spon’s Price Books.
Over the last 12 months between October 2011 and October 2012, the 60 building work categories recorded an average rise of just 0.1%, down from 0.6% three months ago and maintaining the downward trend that has prevailed since peaking at 5.2% in October last year. Over the last six months (since April 2012), the building work categories have fallen by an average of 0.6%.
Categories displaying the largest price movement over the last year have been:
| Oct 2011- Oct 2012 | % change |
| Pavings: coated macadam and asphalt | 5.7 |
| Sanitary appliances | 4.3 |
| Pipes and accessories: plastics | 3.4 |
| Waterproofing: liquid applied coatings | 3.0 |
| Metal: decking | -3.5 |
| Cladding and covering: aluminium | -4.2 |
| Concrete: reinforcement | -7.5 |
| Finishes: bitumen, resin and rubber latex flooring | -8.0 |
The highest figures can be attributed in part to the increase in oil prices that occurred in the first quarter of the year.
The negative figures reflect the reduction that occurred in steel, aluminium and other metals prices between March and September.
The largest fallers over the last six months:
| April 2012 - Oct 2012 | % change |
| Insulation | -3.1 |
| Concrete: reinforcement | -5.7 |
| Finishes: bitumen, resin and rubber latex flooring | -8.3 |
Materials
Consumer price inflation is on the rise but construction material prices show little movement
03 / EXECUTIVE SUMMARY
- Consumer price inflation rate moves further away from target
- Industry input costs lower than six months ago
- Industry output prices show little recent movement
- Most metals prices, except for lead, slightly lower over the last six months but currently moving up
- Construction materials prices overall relatively benign
- Steel prices have been in decline for most of the year
04 / KEY INDICTORS
| % change | % change | Direction | |
| Consumer prices | Oct 2011 - Oct 2012 | Last 6 months | |
| Consumer prices index | +2.7 | +1.1 | Up |
The rate of consumer price inflation fell steadily from 5.2% in September 2011 to 2.2% in September 2012 but the October index took the headline figure back up to 2.7% largely in response to increases in university tuition fees. The Retail Prices Index jumped similarly from 2.6% in September to 3.2% in October.
| Industry input costs | |||
| Materials & fuels purchased by manufacturing industry | +0.1 | -2.3 | Up |
| Materials and fuels purchased by manufacturing industry excluding food, beverages, tobacco and petroleum industries | -0.3 | -1.3 | Up |
Industry input costs peaked in March this year but declined during the summer, largely in response to the movement of oil prices. Another jump in oil prices in August saw the downward trend halted. Higher fuel prices caused a rise in the index in October.
The movement in input costs for industry excluding food, beverages, tobacco and petroleum industries has been more benign. But three consecutive monthly rises have pushed the index up 1.3% in the three months to October.
| Industry output prices | |||
| Output prices of manufactured products | +2.5 | +0.2 | No change |
| Output prices of manufactured products excluding FBT&P | +1/4 | +0.1 | No change |
Output prices of UK manufactured products have been broadly flat for the last six months. Tobacco and alcohol products have seen the biggest increase over the last year (8.8%). Price increases in product areas associated with construction have been muted:
| Wood and wood products | +0.7 | +0.4 |
| Rubber and plastic products | +0.8 | +0.7 |
| Fabricated metal products | +0.1 | -0.2 |
| Electrical equipment | +0.9 | +0.1 |
| Nov 2011 average - 15 Nov 2012 | May 2012 average - 15 Nov 2012 | ||
| Metals prices | |||
| Copper | +1 | -1 | Down |
| Aluminium | -7 | -3 | Up |
| Zinc | 0 | -1 | Up |
| Nickel | -10 | -6 | No change |
Metals prices were generally in decline for most of 2012 as the eurozone crisis failed to find any resolution and the global economy wavered. Prices rebounded in September as the European Central Bank, the U.S. Federal Reserve and the Bank of Japan provided liquidity injections which boosted investor and business confidence. Prices then drifted back down as the stimulus effect waned but prices for lead, zinc and aluminium have moved back up again in November, the first benefitting from increase demand for batteries following Hurricane Sandy.
Construction industry
Materials price changes for the construction industry over the last year (and six month periods (to September 2012)) are detailed below:
| Sept 2011-Sept 2012 | March 2012-Sept 2012 | ||
| Construction materials for: | |||
| New housing | +0.6 | -0.4 | No change |
| Non-housing new work | +0.2 | -0.9 | No change |
| Repair and maintenance | +0.7 | -0.5 | Up |
Overall, construction materials prices rose by 0.5% over the year to September but declined over the last six months by 0.7%. Prices rose 1.6% in the first four months of the year but then fell back until August. Prices rose slightly in September.
| Mechanical services materials | |||
| Housing only | -3.7 | -1.4 | No change |
| Non-housing | -0.4 | 0 | No change |
| Electrical services materials | -0.5 | -0.5 | No change |
Prices of materials for mechanical services installations for housing have declined steadily over the last year but have been flat for the last four months. Prices for non-housing mechanical services work have been generally flat for the last year. Prices for electrical services materials have declined slightly over the last six months.
Although construction materials prices have generally been benign over the last year, a number of materials have seen significant rises while others have fallen sharply:
% change Oct 2011-Oct 2012 | April 2012 - Oct 2012 | |
| Bituminous mixtures | 9.1 | -0.7 |
| Cements | 6.7 | 0 |
| Paint (non-aqueous) | 6.6 | 0.5 |
| Insulating materials | 3.9 | 1.0 |
| Sand and gravel | -1.9 | -5.5 |
| Imported stone | -3.4 | -1.1 |
| Imported ceramic tiles | -3.5 | 1.3 |
| Cast and spun iron products | -4.0 | 0 |
| Timber | -2.9 | -0.6 |
| Structural steelwork | -2.8 | -2.4 |
| Sheet steel piling | -3.2 | -2.7 |
| Metal sections | -6.6 | -3.4 |
| Steel for reinforcement | -8.6 | -7.3 |
Labour
Weekly earnings are up 1.4%, a smaller rise than average earnings for the whole economy
05 / LABOUR MARKET STATISTICS
- Over the three months to September 2012, weekly earnings in construction averaged £539, just 0.1% higher than the same period the year before. Average earnings throughout the whole economy rose by 1.8% over the same period
- In the second quarter of 2012, the number of people employed in construction fell below 2 million for the first time - 1.996 million, 1.2% lower than in the second quarter of 2011 and 5.6% down on the second quarter of 2010, a loss of 119,000 personnel. But redundancies in the third quarter (12,000) fell to their lowest level since the fourth quarter of 2007.
06 / WAGE AGREEMENTS
Wage rates for building and civil engineering operatives employed under the auspices of the Construction Industry Joint Council (CIJC) will remain unchanged throughout 2012. Agreement has been reached between unions and employers that will see a 2% increase in basic pay from 7 January 2013. The agreement provides for no further changes until at least January 2014.
Operatives employed by members of the Federation of Master Builders and paid in accordance with conditions set by the Building and Allied Trades Joint Industrial Council are also still receiving pay that was set in September 2011 but no further agreement has yet been reached.
Plumbers in Scotland and Northern Ireland were expecting a pay review in June but the parties to the Joint Industry Board have failed to reach agreement and the wage rates and allowances which have operated since June 2011 continue until further notice.
Heating and ventilating operatives have had no increase in wage rates since October 2010. Talks are understood to be in progress but for now rates remain in limbo.
Electricians’ wage rates have been frozen since January 2010 but, after three years, basic rates will increase by 1.5% from 7 January 2013.
The agreement also provides for a further increase of 2% from 6 January 2014.
Parties to the National Joint Council for the Engineering Construction Industry continue to meet to discuss the 2013 Wages and Conditions Review. Employers have put forward their “final” offer but the unions have not recommended it to their members. Wage rates remain those that have been in place since January 2011.
Click here to see the wage agreements table (also attached)
Downloads
Wage agreements
PDF, Size 0 kb


No comments yet