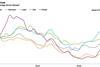
Labour cost inflation continues to be the prime driver for an overall rise in building costs, but increased material costs are also playing their part. Michael Hubbard of Aecom reports

01 / Key changes

Percentage change year-on-year (Q2 2015 to Q2 2016)

 %Direction
Building cost index+1.4
Mechanical cost index+2.2
Electrical cost index+2.2
Consumer prices index+0.4

(Q2 2016 figures are provisional)

Building cost index

A composite measure of building costs increased over the last 12 months by 1.4% at Q2 2016. Labour costs are still rising, and materials cost inflation is now also contributing to the overall increase.

Mechanical cost index

The rate of annual change increased to 2.2% at Q2 2016 from 1.1% in the preceding quarter. Labour costs remain the primary driver of inflationary trends in this index.

Electrical cost index

The electrical cost index increased by 2.2% over the year. Again, the annual change results primarily from labour cost increases, with materials still largely benign though this may change in coming quarters.

Consumer prices index

Consumer price inflation picked up slightly in Q2 2016, recording 0.4% annual change. Latter months in the quarter were higher than this, reflecting some pressures now thought to be in the system.

The following chart shows Aecom’s index series since 2005, reflecting cost movements in different sectors of the construction industry and consumer prices.

AECOM indices

02 / Price adjustment formulae for construction contracts

Price Adjustment Formulae indices, compiled by the Building Cost Information Service (previously by the Department for Business Innovation & Skills), are designed for the calculation of increased costs on fluctuating or variation of price contracts. They provide guidance on cost changes in various trades and industry sectors and on the differential movement of work sections in Spon’s price books.

The 60 building work categories recorded an average increase of 2% on a yearly basis.

Higher increases were recorded in the following categories:

August 2015 – August 2016% change
Metal: decking6.2
Windows and doors: steel6.2
Cladding and covering: aluminium5.7
Cladding and covering: plastics5.4
Raised access floors4.9
Pipes and accessories: aluminium4.2
Cladding and covering: fibre cement3.9

The largest price decreases include:

August 2015 – August 2016% change
Cladding and covering: copper-1.8
Pavings: coated macadam and asphalt-1.3
Windows and doors: aluminium-1
Cladding and covering: zinc-1
Insulation-0.5
Pipe and accessories: copper-0.4

Materials

03 / Summary

  • Consumer price inflation increased by 0.6% in July 2016 compared with the same month a year earlier ▲
  • Manufacturing input prices increased 4.3% in the year to July, continuing a trend established in November 2015 ▲
  • Factory gate prices (output prices) rose 0.3% in the year to July 2016, marking the first annual increase since June 2014 ▲
  • Commodity prices have posted notable annual increases for the first time in over 12 months ▲
  • Construction materials prices increased on a monthly basis in July but fell overall on an annual basis ▼

04 / Key Indicators

Construction industry

The All Work material price index declined by 0.2% in the year to July 2016, although the index increased by 0.3% compared with the previous month. Housing-related materials increased by 0.8% over the last 12 months. Non-housing materials prices fell over the year though, declining by 0.4%. All M&E categories posted small annual increases.

Construction materials% change, July 2015 – July 2016* 
New housing0.8
Non-housing new work-0.4
Repair and maintenance0.6
Mechanical services materials% change, August 2015 – August 2016* 
Housing only0.5
Non-housing0.5
Electrical services materials1.1

*provisional

 % change, July 2015 – July 2016
Electric water heaters4.9
Pre-cast concrete products: bricks, blocks, tiles and flagstones4.5
Pre-cast concrete products: generally3.7
Sanitaryware: plastic3.6
Imported sawn or planed wood3.3
Doors and windows: timber2.7
Fabricated structural steel-1.7
Particle board-1.9
Pipes and fittings: plastic flexible-2
Ironmongery-2.4
Sawn wood-3.8
Imported plywood-4.3

Data sources: ONS and BEIS

UK economy

Consumer prices% change July 2015 – July 2016 
Consumer Prices Index (CPI)0.6

Consumer price inflation rose by 0.6% in July. Some inflationary pressures have been introduced into the system as a result of changes to sterling against its major currency pairs. Consequently, it is now thought that the inflation outlook may be a little higher than the benign outlook previously forecast.

Industry input costs% change July 2015 – July 2016 
Materials and fuels purchased by manufacturing industry4.3
Materials and fuels purchased by manufacturing industry excluding food, beverages, tobacco and petroleum industries4.7

Input prices increased by 4.3% on a yearly basis up to July 2016. This is the first annual increase since September 2013. These recent data points mark a notable rise in input costs, particularly when overall trends have been negative for so long. Some of the rises are attributable to weaker sterling experienced through 2016 as, all other things being equal, lower sterling tends to raise sterling prices of imports. Additionally, as the oil price has stabilised at around $40-50/barrel, its contribution to negative overall input cost trends has waned. Imported food, metals, parts and equipment are all major components of the overall increase.

Industry output costs% change July 2015 – July 2016 
Output prices of manufactured products0.3
Output prices of manufactured products excluding food, beverages, tobacco and petroleum1

Factory gate prices increased 0.3% on a yearly basis in July. This is the first annual increase since June 2014. A combination of higher input costs, a stronger labour market and increased confidence among manufacturers to pass on higher prices to consumers all contribute to recent changes. Again, the effect of falling oil prices has much less effect now in sustaining the falling or flat output price trends of recent quarters. The core index, which is narrower because it excludes items such as petroleum and food, increased by 1% in the year to July 2016. With higher input costs, output prices will come under pressure to be increased further still over the near-term.

Metal prices

Metals prices

Source: LME

 % change August 2015 – August 2016 
Aluminium6.6
Copper-6.5
Lead8.6
Zinc26.1
Nickel§

Commodities price trends showed signs of life and reversing the long-established downward trend of the last two years. Apparent efforts to address production over-capacity have provided support to prices, along with some improvement in aggregate demand. Denominator effects also play a part in the yearly change calculation.

Exchange rates

Exchange rates

 August 2015 averageAugust 2016 average% change
GBP / EUR1.40041.168-16.6
GBP / USD1.55831.31-15.9

Sterling was sold off heavily immediately after the EU referendum outcome, against both the Euro and the US dollar. Although sterling is described as being significantly weaker against the Euro, this is relative to its recent history. A longer-term comparison with the Euro shows sterling back to levels recorded through the period 2009 to 2013. The period prior to the referendum also saw a sustained reversal in sterling’s appreciation up to early 2015. Against the US dollar, sterling is materially weaker, now at a level not seen since the mid-1980s. This is not due entirely to the referendum outcome, instead it also reflects the relative positions of each country’s economic position more broadly.

Labour

05 / Labour market statistics

  • Average weekly earnings (total pay including bonuses) in construction fell to £606 in June 2016, from £629 a month earlier. Annually, total earnings increased 7% in June on a single-month basis, and 8.4% annually on a three-month average basis. Regular pay (excluding bonuses and arrears) declined marginally to £583 per week in June, with annual rates of 6.7% on a single-month basis and 7.3% using a three-month average.
  • Construction industry regular and total pay continues to exceed changes to average earnings for the whole economy classification, which were just over 2% at June 2016.
  • Real average weekly earnings for the whole economy rose 1.7% (regular pay) in June 2016.

06 / Wage agreements

Construction Industry Joint Council

Following negotiations between the parties to CIJC, the council has agreed a two-year agreement on pay and other conditions. Hourly pay rates will increase by 2.5% from 25 July 2016 and then by a further 2.75% in June 2017. Industry sick pay and subsistence allowance will also increase in line with the basic pay rate increases. Workers will receive an extra day’s holiday from 1 January 2017, which is worth an additional 0.4%.

Joint Council Committee of the Heating, Ventilating and Domestic Engineering Industry

A two-phase agreement has been agreed between BESA and Unite trade unions. Phase 1 includes 2% and 2.5% increases in the hourly wage rate effective from 3 October 2016 and 2 October 2017 respectively. Phase 2 covers the periods 2018/2019 and 2019/2020 involving increases in index and other benefits agreed in July 2016. 2018 and 2019 hourly wage rate discussions will take place towards the end of 2016. Introduction of calculating daily fare and travel allowances has been changed from kilometres to miles. Workers annual holiday to increase from 23 to 24 days effective from February 2020.

The Joint Industry Board for the Electrical Contracting Industry

The electrical contracting industry has agreed a four-year wage deal, effective from January 2017. Hourly wage increases of 2% in 2017, 2.5% in 2018, 2.75% in 2019 and 3% in 2020. Introduction of a new mileage allowance and rate to replace travel allowance and travel time also comes into effect. Annual holidays increase to 23 days in 2019 and 24 days in 2020. For more information on the agreement, refer to the Electrical Contractors’ Association and Unite wage agreement document – July 2016.

Building and Allied Trades Joint Industry Council

The Building and Allied Trades Joint Industrial Council (BATJIC) agreed a two-year pay deal effective from 27th June 2016. Workers will receive a 2.5% pay rise this year and a further 2.5% increase in 2017. Lower paid operatives will get a bigger boost of 4% this year, followed by 2.5% next year. The agreement includes a commitment that, if inflation in early 2017 is higher than 2.5%, then the 2017 pay rise will match this up to a limit of 3%.

The Joint Industry Board for Plumbing, Mechanical Engineering Services in England and Wales

A 2.5% increase in hourly rates came into effect from 4 January 2016. Employees rates of pay, allowances entitlements and benefits are published in promulgation No. 171 of JIB for Plumbing, Mechanical Engineering Services in England and Wales agreement.

The BATJIC rates of wages effective from 27 June 2016 are:

Standard rates of pay for 39 hours per weekPer weekPer hour
S/NVQ3: Advanced£459.81£11.79
S/NVQ2: Intermediate£395.85£10.15
Adult General Operative£351£9
For entrants aged 19 years and over  
” Third 12 months with NVQ2£374.01£9.59
” Third 12 months without NVQ£325.65£8.35
Apprentices under 19 years of age  
” 18 years of age with NVQ2£307.71£7.89
” 18 years of age without NVQ2£325.65£8.35
WAGE AGREEMENT SUMMARY
The following table summarises the wage agreements currently in force for the principal wage fixing bodies within the construction industry
OperativesAgreement bodyCurrent basic hourly rateEffective sinceDetails inDate of next review
Builders and civil engineering operativesConstruction Industry Joint CouncilCraft rate: £11.61 / hour25 July 2016Spon’s Architects’ and Builders’ Price Book 2017June 2018
Building and Allied Trades Joint Industrial Council (BATJIC)S/NVQ3 Advanced Craft: £11.79 / hour27 June 2016Spon’s Architects’ and Builders’ Price Book 2017June 2017
PlumbersThe Joint Industry Board for Plumbing Mechanical Engineering Services in England and WalesAdvanced Plumber: £14.41 / hour4 January 2016Spon’s Architects’ and Builders’ Price Book 20172 January 2017
Scottish and Northern Ireland Joint Industry Board for the Plumbing IndustryAdvanced Plumber: £13.68 / hour4 July 2016Spon’s Architects’ and Builders’ Price Book 2017July 2017
H&V operativesJoint Conciliation Committee of the Heating, Ventilating and Domestic Engineering IndustryCraftsman: £12.46 / hour3 October 2016Joint Conciliation Committee of the Heating, Ventilating and Domestic Engineering IndustryEnd of 2016 for years 2018 and 2019
Electricians (national)The Joint Industry Board for the Electrical Contracting IndustryApproved electrician: £15.92 / hour (own transport)2 January 2017JIB for the Electrical Contracting IndustryA four-year agreement 2021
Scottish Joint Industry Board for the Electrical Contracting IndustryApproved electrician: £15.61 / hour (own transport)4 January 2016SJIB for the Electrical Contracting IndustryJanuary 2017

Guide to data

Aecom’s cost indices track movements in the input costs of construction work in various sectors, incorporating national wage agreements and changes in materials prices as measured by government index series.

They are intended to provide an underlying indication of price changes and differential movements in the various work sectors but do not reflect changes in market conditions affecting profit and overheads provisions, site wage rates, bonuses or materials’ price discounts/premiums. Market conditions and commentary are outlined in Aecom’s quarterly Market Forecast (last published August 2016).