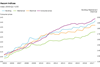
Price pressures continue to be caused by weak productivity aggravated by Brexit negotiations, while exchange rates improved as the Bank of England prepared to raise interest rates. David Holmes of Aecom reports


01 / Key changes

Percentage change year-on-year (Q3 2016 to Q3 2017)

 %Direction
Building cost index +3.9
Mechanical cost index +3.4
Electrical cost index +2.5
Consumer prices index +2.8

(Q3 2017 figures are provisional)

Building cost index
A composite measure of building costs increased over the past 12 months by 3.9% at Q3 2017. Materials cost inflation continues to increase, as do labour rates. Inflation arising from higher imported materials costs due to the sterling valuation against the euro will continue to be a focus for projects with currency-linked packages such as curtain walling. 

Mechanical cost index
The rate of annual change increased to 3.4% at Q3 2017. Both labour and materials components of the index show increases.

Electrical cost index
Aecom’s electrical cost index increased by 2.5% over the year. The materials component of the index recorded a 4% change in the 12 months to Q3 2017.

Consumer prices index
Consumer price inflation maintained a steady rate through the third quarter of 2017. The largest fall was recorded in motor fuel but this was offset by increases in a range of food and recreational goods.

The following chart shows Aecom’s index series since 2005, reflecting cost movements in different sectors of the construction industry and consumer prices.

Screen shot 2017 12 06 at 16.30.13

02 / Price adjustment formulae for construction contracts

Price adjustment formulae indices, compiled by the Building Cost Information Service (previously by the Department for Business Innovation and Skills), are designed for the calculation of increased costs on fluctuating or variation of price contracts. They provide guidance on cost changes in various trades and industry sectors – ie those including labour, plant and materials – and on the differential movement of work sections in Spon’s price books.

The 60 building work categories recorded an average increase of 4.5% on a yearly basis. The six highest increases were recorded in the following categories:

Price adjustment formulae

Sep 2016 – Sep 2017% change
Cladding and covering: copper 14.8
Pipes and accessories: copper 13.8
Cladding and covering: lead 13.2
Cladding and covering: zinc 10.4
Windows and doors: steel 9.1
Windows and doors: aluminium 8.1

No items recorded a yearly decline. The six lowest increases were in the following categories:

Price adjustment formulae

Sep 2016 – Sep 2017% change
Pipes and accessories: plastics 1.9
Finishes: flexible tiles and coverings 1.7
Pipes and accessories: clay and concrete 1.6
Filling: imported hardcore and granular 1.6
Finishes: screeds 1.4
Finishes: rigid tiles and terrazzo work 0.5

Materials

03 / Summary

  • Consumer price inflation increased by 3% in October 2017 compared with the same month a year earlier ▲
  • Manufacturing input prices increased 4.6% in the year to October ▲
  • Factory gate prices (output prices) rose 2.8% in the year to October 2017 ▲
  • Commodity prices in Q3 2017 reversed all of the falls seen at the start of the year and are showing some big increases ▲
  • Construction materials prices continued to increase on an annual basis in Q3 2017 ▲

04 / Key indicators

Construction industry
The all-work materials price index increased by 5.2% in the 12 months to September 2017. Housing-related materials increased by 5.3% in the same period. Non-housing materials prices also rose, by 5.2% annually. All M&E categories posted significant yearly increases.

Construction materials% change Sep 2016 – Sep 2017*
New housing 5.3
Non-housing new work 5.2
Repair and maintenance 5.7
Mechanical services materials% change Sep 2016 – Sep 2017*
Housing only 14.4
Non-housing 7.3
Electrical services materials 4.2
Materials showing largest cost movement% change Sep 2016 – Sep 2017*
Concrete reinforcing bars (steel) +17.6
Sawn wood +8.4
Imported sawn or planed wood +8.3
Particle wood +7.2
Fabricated structural steel +7.0
Metal doors and windows +5.9
Imported plywood +5.2
Paint (non-aqueous) +5.1

Data sources: ONS and BEIS

*provisional

UK economy

Consumer prices% change: Oct 2016 – Oct 2017
Consumer Prices Index (CPI) 3.0 ▲

Consumer price inflation rose in the 12 months to October by 3%, the highest since April 2012, helping to bring on a Bank of England interest rate rise. Continued increase of raw materials costs are set to feed into the supply chain and subsequent consumer prices, which could affect input cost inflation over the next period. Recreation prices rose sharply along with non-seasonal food prices. Underlying price pressures are not as a result of stronger demand but from weak productivity aggravated by ongoing Brexit negotiations.

Industry input costs% changeOct 2016 – Oct 2017
Materials and fuels purchased by manufacturing industry 4.6
Materials and fuels purchased by manufacturing industry excluding food, beverages, tobacco and petroleum industries 3.2

Input costs increased by 4.6% on a yearly basis up to October 2017, down from 8.1% in September 2017. The largest single upward contribution came from crude oil, which contributed 1.5%, driven mainly by an annual increase of 10.6% in prices for imported crude petroleum and natural gas.

Industry output costs% changeOct 2016 – Oct 2017
Output prices of manufactured products 2.8
Output prices of manufactured products excluding food, beverages, tobacco and petroleum 2.1

Source: ONS

Factory gate prices increased by 2.8% on a yearly basis to October, down from 3.3% in September 2017. As recent large rises in input costs have eased a little, output prices continued to increase steadily. This offers some respite for producers in managing the balance between input cost pressure and output prices. However, the rate of change in output price inflation has slowed through 2017.

Metal prices

Screen shot 2017 12 06 at 16.37.14

 % changeJuly 2016 – July 2017
Aluminium 28.1
Copper 43.7
Lead 22.9
Zinc 41.5
Nickel 10.4

Source:  LME

Commodity prices show an increase in excess of 22% this year, according to the World Bank in its October Commodity Markets Outlook. The actual impact of commodity prices on the price of the manufactured item is usually quite limited, depending on the value of the commodity as part of the final product. The metals index is expected to stabilise next year as a correction in iron ore prices is offset by increases in other base metals.

Exchange rates

Screen shot 2017 12 06 at 16.37.43

 Oct 2016 averageOct 2017 average% change
GBP / EUR 1.1190 1.1227 +0.3
GBP / USD 1.2329 1.3197 +7.0

The pound has been rising against all other currencies as investors looked at the possibility of the Bank of England raising interest rates. Since the announcement of the first interest rate rise in a decade, to 0.5%, exchange rates have reverted to their more recent trends.

US dollar and euro exchange rates enjoy quite a close correlation – if the euro is stronger it will typically push the dollar down across most currencies. Against the US dollar, sterling’s performance is better but this also reflects the changing views about the US economic landscape and proposed tax reforms by reductions in corporate tax rate.

Labour

05 / Labour market statistics

  • Average weekly earnings (total pay including bonuses) in construction increased to £610 in September 2017, from £583 a month earlier. Annually, total earnings increased just 3.2% to October on a single-month basis. Regular pay (excluding bonuses and arrears) rose to £575 a week in September, from £568 a month earlier.

  • Construction industry regular and total pay rates are ahead of average earnings for the whole economy, rising by 2% for July – September 2017 compared with July – September 2016.

  • Real average weekly earnings for the whole economy rose by just 0.05% (regular pay) for July – September 2017 compared with July – September 2016.

06 / Wage agreements

Construction Industry Joint Council

Following negotiations between the parties to CIJC, the council has agreed a two-year agreement on pay and other conditions. This is the second phase of a two-year agreement reached in June 2016. Hourly pay rates increased by 2.75% in June 2017. Industry sick pay and subsistence allowance increased in line with the basic pay rate increases. Workers have received an extra day’s holiday since 1 January 2017, which is worth an additional 0.4%. For more details on apprentice rates, daily fare and travelling allowance and other rates refer to CIJC document IR.2016.19.

Joint Council Committee of the Heating, Ventilating and Domestic Engineering Industry

A two-phase agreement has been agreed between BESA and Unite trade unions. Phase 1: A 2% and 2.5% increases in hourly wage rate effective from 3 October 2016 and 2 October 2017 respectively. Phase 2: Covering period 2018/2019 and 2019/2020 involving increases in index and other benefits agreed in July 2016. Introduction of calculating daily fare and travel allowances has been changed from kilometres to miles. Workers annual holiday to increase from 23 to 24 days effective from February 2020. For more information on agreement, refer to JCC letter 117 of BESA.

The Joint Industry Board for the Electrical Contracting Industry

The industry has agreed on a four-year wage deal, which was effective from January 2017. Hourly wage increases of 2% in 2017, 2.5% in 2018, 2.75% in 2019 and 3% in 2020. Introduction of new mileage allowance and rate to replace travel allowance and travel time. Annual holidays to increase to 23 days in 2019 and 24 days in 2020. For more information on agreement, refer to the electricals’ and unite wage agreement document – July 2016.

Building and Allied Trades Joint Industry Council

As the second part of a two-year agreement reached in 2016, this year will see a further 2.5% pay rise in all wage rates. Changes to employer pension contribution mean the minimum employer contribution prior to 5 April 2017 under pension’s auto-enrolment rules is 1% of pensionable pay between £5,824 and £42,385. From 6 April 2017 until 5 April 2019 this minimum employer contribution rises to 2%. From 6 April 2019 onwards it rises to 3%.

The Joint Industry Board for Plumbing, Mechanical Engineering Services in England and Wales

This is the second phase of the agreement completed in 2015. Rates for workers in JIB-PMES increased by 2% effective from 2 January 2017.

Scottish and Northern Ireland Joint Industry Board for the Plumbing Industry

The SNIJIB reached a two-year wage deal effective from 3 July 2017. An hourly wage increase of 2% in 2017 and 2018 respectively was agreed. For more information, refer to SNIJIB wage agreement document – July 2017.

The BATJIC rates of wages effective from 26 June 2017 are:

Standard rates of pay for 39 hours per weekPer weekPer hour
S/NVQ3: Advanced £471.12 £12.08
S/NVQ2: Intermediate £405.60 £10.40
Adult general operative £359.97 £9.23
For entrants aged 19 years and over    
Third 12 months with NVQ2 £383.37 £9.83
Third 12 months without NVQ £333.84 £8.56
Apprentices under 19 years of age    
18 years of age with NVQ2 £315.51 £8.09
18 years of age without NVQ2 £333.84 £8.56

WAGE AGREEMENT SUMMARY

The following table summarises the wage agreements currently in force for the principal wage fixing bodies within the construction industry

OperativesAgreement body Current basic hourly rate Effective since Details in Date of next review 
Builders and civil engineering operatives Construction Industry Joint Council Craft rate: £11.93/hour 26 June 2017 Spon’s Architects’ and Builders’ Price Book 2018 June 2018
  Building and Allied Trades Joint Industrial Council (BATJIC) S/NVQ3 advanced craft: £12.08/hour  26 June 2017 Spon’s Architects’ and Builders’ Price Book 2018  June 2018 
Plumbers The Joint Industry Board for Plumbing Mechanical Engineering Services in England and Wales  Advanced plumber: £14.70/hour  2 January 2017 Spon’s Architects’ and Builders’ Price Book 2018 January 2018 
  Scottish and Northern Ireland Joint Industry Board for the Plumbing Industry  Advanced plumber: £13.95/hour 3 July 2017 Spon’s Architects’ and Builders’ Price Book 2018 July 2019 
H&V operatives  Joint Conciliation Committee of the Heating, Ventilation and Domestic Engineering Industry  Craftsman: £12.46/hour   2 October 2016 Joint Conciliation Comittee of the Heating, Ventilation and Domestic Engineering Industry A two-year agreement. Next review end of 2017 for October 2018 and 2019 
Electricians (national)  The Joint Industry Board for the Electrical Contracting Industry  Approved electrician: £15.92/hour (own transport)  2 January 2017 JIB for the Electrical Contracting Industry  A four-year agreement. Next review 2021 
  Scottish Joint Industry Board for the Electrical Contracting Industry  Approved electrician: £15.92/hour (own transport)  2 January 2017 SJIB for the Electrical Contracting Industry  A four-year agreement. Next review 2021 

Guide to data

Aecom’s cost indices track movements in the input costs of construction work in various sectors, incorporating national wage agreements and changes in materials prices as measured by government index series.

They are intended to provide an underlying indication of price changes and differential movements in the various work sectors but do not reflect changes in market conditions affecting profit and overheads provisions, site wage rates, bonuses or materials’ price discounts/premiums. Market conditions and commentary are outlined in Aecom’s quarterly Market Forecast (last published November 2017).