Materials cost increases due to sterling depreciation, combined with rising labour costs, exerted steady pressure on construction costs last quarter. Jay Kotecha of Aecom reports
01 / Key changes
Percentage change year-on-year (Q4 2016 to Q4 2017)
| % | Direction | |
|---|---|---|
| Building cost index | +4.2 | ▲ |
| Mechanical cost index | +4.0 | ▲ |
| Electrical cost index | +2.3 | ▲ |
| Consumer prices index | +3.1 | ▲ |
(Q4 2017 figures are provisional)
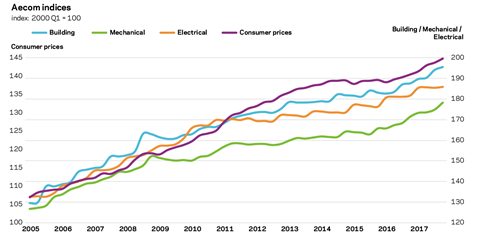
Building cost index
This composite measure of building costs increased by 4.2% over the 12 months to Q4 2017. Materials cost inflation increased noticeably over the period, resulting from a combination of sterling depreciation and new year price increases. Labour costs continued to rise, although the pace of change slowed, reflecting some of the corresponding slowdown in overall construction output.
Mechanical cost index
The rate of annual change rose to 4% in Q4 2017, thanks to increases in the labour and materials components. Higher imported materials costs due to sterling’s weakness against the euro continued to add pressures.
Electrical cost index
The increase of 2.3% over the year represented a slower rate than in the year to Q3 2017. However, momentum remains in the annual rate of change from a combination of demand and foreign exchange-related dynamics.
Consumer prices index
This maintained its elevated rate of change, driven by recreational and cultural goods and services, rather than items linked to industrial inputs. Consumer price inflation is expected to stay elevated through 2018.
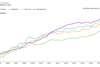
The following chart shows Aecom’s index series since 2005, reflecting cost movements in different sectors of the construction industry and consumer prices.
02 / Price adjustment formulae for construction contracts
Price adjustment formulae indices, compiled by the Building Cost Information Service (previously by the Department for Business Innovation and Skills), are designed for the calculation of increased costs on fluctuating or variation of price contracts. They provide guidance on cost changes in various trades and industry sectors – ie those including labour, plant and materials – and on the differential movement of work sections in Spon’s price books.
The 60 building work categories recorded an average increase of 4.4% on a yearly basis. The six highest increases were recorded in the following categories:
Price adjustment formulae
| Jan 2017 – Jan 2018 | % change |
|---|---|
| Concrete: reinforcement | 10.0 |
| Windows and doors: steel | 9.8 |
| Cladding and covering: copper | 9.4 |
| Cladding and covering: coated steel | 8.9 |
| Pipes and accessories: copper | 8.8 |
| Cladding and covering: zinc | 8.3 |
Again, no items recorded a yearly decline. The six lowest increases were in the following categories:
Price adjustment formulae
| Jan 2017 – Jan 2018 | % change |
|---|---|
| Finishes: carpets | 1.0 |
| Pavings: coated macadam and asphalt | 1.1 |
| Filling: imported, hardcore and granular | 1.2 |
| Finishes: flexible tiles and sheet coverings | 1.7 |
| Cladding and covering: aluminium | 1.7 |
| Finishes: screeds | 1.8 |
Materials
03 / Summary
- Consumer price inflation increased by 2.7% in January 2018 compared with the same month a year earlier ▲
- Manufacturing input prices increased 4.7% in the year to January ▲
- Factory gate prices (output prices) rose 2.8% in the year to January 2018 ▲
- Commodity prices maintained an upwards trajectory in Q4 2017 on the back of resurgent global economic activity ▲
- Construction materials prices continued to increase on an annual basis in Q4 2017 ▲
04 / Key indicators
Construction industry
The BEIS all-work materials price index increased by 5.5% in the 12 months to December 2017. Housing-related materials increased by 6.2% in the same period. Non-housing materials prices also rose, by 5.6% annually. All M&E categories posted significant yearly increases.
| Construction materials | % change Dec 2016 – Dec 2017* | |
|---|---|---|
| New housing | 6.2 | ▲ |
| Non-housing new work | 5.6 | ▲ |
| Repair and maintenance | 6.4 | ▲ |
| Mechanical services materials | % change Dec 2016 – Dec 2017* | |
|---|---|---|
| Housing only | 11.4 | ▲ |
| Non-housing | 5.6 | ▲ |
| Electrical services materials | 2.5 | ▲ |
| Materials showing largest cost movement | % change Dec 2016 – Dec 2017* |
|---|---|
| Concrete reinforcing bars (steel) | +14.7 |
| Fabricated structural steel | +12.3 |
| Sawn wood | +10.8 |
| Particle wood | +9.4 |
| Imported sawn or planed wood | +7.5 |
| Metal sanitaryware | +4.6 |
| Window and doors: metal | +4.5 |
| Pre-cast concrete products: blocks and bricks | +4.2 |
Data sources: ONS and BEIS
*provisional
UK economy
| Consumer prices | % change: Jan 2017 – Jan 2018 |
|---|---|
| Consumer Prices Index (CPI) | 2.7 ▲ |
Consumer price inflation including owner-occupiers’ housing costs was 2.7% in the 12 months to January 2018. This rate of change matched that recorded in December 2017. Underlying price pressures stemmed largely from sterling remaining lower for longer, in turn importing inflation into the UK economic system. On-going inflationary pressures will continue to feed into the raw materials costs used by supply chains – both in general economic sectors and specific to construction. Additionally, there will be sustained tension on real wages as consumer price inflation exceeds changes in wages and earnings.
| Industry input costs | % change | Jan 2017 – Jan 2018 |
|---|---|---|
| Materials and fuels purchased by manufacturing industry | 4.7 | ▲ |
| Materials and fuels purchased by manufacturing industry excluding food, beverages, tobacco and petroleum industries | 3.1 | ▲ |
Input costs increased by 4.7% on a yearly basis to January 2018. Although this is still an elevated rate of annual change, it does mark the lowest recorded value for 18 months and is down from 5.4% in December 2017. Again, the largest upward contribution came from crude oil, which contributed more than two percentage points, driven primarily by a 13% increase in imported crude petroleum and natural gas prices.
| Industry output costs | % change | Jan 2017 – Jan 2018 |
|---|---|---|
| Output prices of manufactured products | 2.8 | ▲ |
| Output prices of manufactured products excluding food, beverages, tobacco and petroleum | 2.2 | ▲ |
Source: ONS
Factory gate prices increased by 2.8% on a yearly basis to January. While 2017 witnessed a gradual slowing in the rate of output price inflation for manufactured products, pressure remains for producers as input costs have not slowed to the same extent. The annual rate dropped by 0.5 percentage points between December 2017 and January 2018 as a result of downward contributions from eight industry sectors.
Metal prices
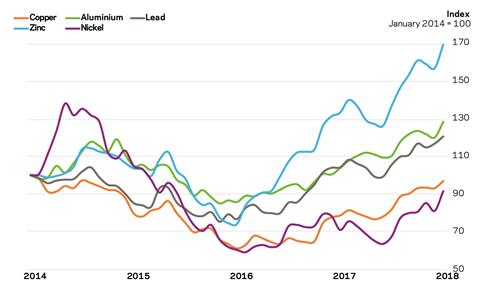
| % change | Jan 2017 – Jan 2018 | |
|---|---|---|
| Aluminium | 23.6 | ▲ |
| Copper | 23.4 | ▲ |
| Lead | 15.7 | ▲ |
| Zinc | 27.0 | ▲ |
| Nickel | 29.0 | ▲ |
Source: LME
Commodity prices continued to rise on the back of higher demand from increased global economic activity. An average 24% increase over 2017 marks a significant rebound in the fortunes of commodity markets, with non-energy commodity prices recording seven consecutive months of rises.
Provided this global pick-up maintains its pace, metals commodity prices are likely to see further increases through the course of 2018. Tight supply for base metals such as zinc, nickel and lead is also expected to offer price support. But the imposition of import tariffs by the US on steel and aluminium may cast a shadow over the mechanics of global trade, particularly where retaliatory measures are implemented by many other countries.
Exchange rates
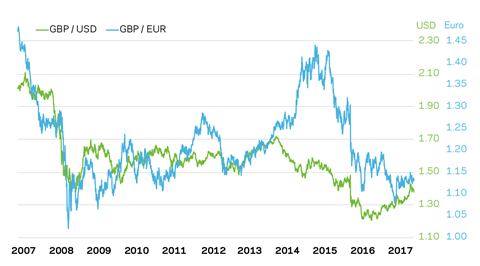
| Jan 2017 average | Jan 2018 average | % change | |
|---|---|---|---|
| GBP / EUR | 1.1331 | 1.1613 | -2.4 |
| GBP / USD | 1.2351 | 1.38327 | +12.0 |
Sterling has continued to rally against the US dollar but less so against the euro. This weaker movement against the euro is partly due to the current and expected improvement in economic growth for the eurozone. Speculation around the prospect of interest rate increases in each respective economic area has also moved foreign exchange rates in recent months.
The recent high for sterling against the US dollar has waned, partly in response to on-going political and economic concerns around Brexit. Regulatory framework questions on the UK’s future trading arrangements also add to the uncertainty and weigh on sterling’s outlook.
Labour
05 / Labour market statistics
- Average weekly earnings (total pay including bonuses) in construction rose to £606 in December 2017, up from £603 a month earlier. Annually, total earnings increased by just 2.3% to December on a single-month basis. Regular pay (excluding bonuses and arrears) rose to £585 per week in December, from £575 a month earlier.
- Construction industry regular pay rates maintained a lead over average earnings for the UK economy, rising by an average of 2.9% for the three-months to December 2017 versus 2.5% for the whole economy classification.
- Real average weekly earnings for the whole economy fell by 0.3% (regular pay) for October-December 2017 when compared with October-December 2016.
Aecom’s cost indices track movements in the input costs of construction work in various sectors, incorporating national wage agreements and changes in materials prices as measured by government index series.
They are intended to provide an underlying indication of price changes and differential movements in the various work sectors but do not reflect changes in market conditions affecting profit and overheads provisions, site wage rates, bonuses or materials’ price discounts/premiums. Market conditions and commentary are outlined in Aecom’s quarterly Market Forecast (last published February 2018).


No comments yet