We make our quarterly inspection of inflation in the industry, and find that it's chugging along at the 1-2% mark – but there is a 23% wage rise for craftsmen in the pipeline and the cost of some works packages are rising rapidly. Hot Rates focuses on claddings and coverings
<B><font size="+2">Hot Rates: cladding and coverings</font></b>
This quarter's edition of Hot Rates details prices being received in three regions for cladding and roof coverings. The rates are associated with medium-sized building projects worth between £500,000 and £3m and assume straightforward access to the site. The rates shown are averages from successful competitively bid tenders received over the past three months. They include overheads and profit but exclude any allowance for preliminaries. The rates are shown for the South-east, Midlands and East Anglia, but can vary considerably within regions and between projects.<B><font size="+2">Consumer price inflation </font></b>
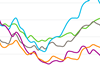
Inflation, as measured by the headline Retail Prices Index, has eased from its peak in February of 3.2% to an annual rate of 2.9% in June. Over the past year, inflation has been dominated by housing costs, which have risen 7.9% – principally as a result of an 18% increase in depreciation costs and a 12% rise in council tax and rates. Fares and other travel costs have risen 7.4% over the year. The upward trend of most inputs to the index has been partially balanced by a 3.3% reduction in the price of leisure goods, influenced by a continuing fall in the price of audiovisual equipment, and clothing and footwear, which are down 2.0%.
The government's target inflation index, RPIX, which excludes mortgage interest payments, has closely matched RPI during 2003 and stands at an annualised rate of 2.8%, just above the target of 2.5%.
The consensus opinion of 22 independent City and other economic forecasters is that the RPI and the RPIX will fall to the target figure of 2.5% by the end of 2003. By the end of 2004, RPI is generally expected to have risen minimally to 2.7%, and RPIX is expected to have eased fractionally to 2.3%.
Inflation portrayed by RPIY, the index that excludes mortgage interest payments and indirect taxes (such as council tax, duties, vehicle excise duty, insurance tax and air passenger duty), and which is therefore more indicative of true underlying inflation, also reflects a similar level of price increase over the past year, now standing at 2.7%, although this is a fall from March's 10-year record of 3.2%.
The annual rate of inflation of the Harmonised Index of Consumer Prices – the index of inflation calculated by each member state of the European Union for the purposes of European comparisons – has fallen since the beginning of the year to 1.1%. The EU average in May stood at 1.8%; it was 2.3% earlier in the year. Over the past six months the index has risen only 0.3%.
The difference between HICP and the RPI series is the result largely of the exclusion from HICP of housing costs. The margin between HICP and RPIX is currently the widest it has been for 14 years. The chancellor has announced that, from November, HICP will be used as the target inflation index, though the target figure has yet to be announced.
<B>Input costs </b>
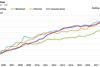
The costs of materials and fuels purchased by industry generally show an increase of 1.9% over the year to June. However, since February the index has shown a fall of 2.8% in seasonally adjusted prices.
On the annual basis, the increase has been dominated by a 9% rise in home food materials. The decline since February was mainly due to an 18% fall in crude oil prices in April.
Input costs for manufacturing industries excluding food, beverages, tobacco and petroleum industries have risen at a slightly lower annual rate of 1.1%, but seasonally adjusted prices have risen 0.7% since February, without the effect of crude oil prices described above.
<B>Output prices </b>
Output prices generally have increased 1.1% over the past year. The recent pattern of input costs suggest that the outlook for output costs remains generally benign.
<B>Construction materials </b>
ONS figures show that construction materials prices have risen 2.5% over the year to June, with housebuilding materials rising 1.8%. Construction materials prices generally rose 1.5% between December last year and April 2003 but have been static over the past couple of months.
Mechanical and electrical materials prices continue to be more subdued than general building materials, the former rising 0.4% over the last year and the latter declining 0.3%.
<b><font size="+2">Price Adjustment Formulae for Construction Contracts</font></b>
Price Adjustment Formulae Indices were designed for the calculation of increased costs on fluctuating price contracts. Indices are published monthly by The Stationery Office in Price Adjustment Formulae for Construction Contracts: Monthly Bulletin of Indices. They also provide useful guidance on cost changes in various trades and industry sectors and on the differential movement of work sections in Spon's Price Books.
Over the past 12 months, between July 2002 and July 2003, the average movement in the 60 building formula work categories has been an increase of 3.9%. Over this time, building labour has increased 5.4%, plumbing labour 6.5%, electrical labour 5.3%, mechanical labour 9.2% and plant 4.8%. In spite of these substantial increases, two work categories have showed small decreases over the period. These are: <table width="350" border="0" bordercolor="#CCCCCC"> <tr bgcolor="#000066" bordercolor="#CCCCCC"> <td><font face="Arial, Helvetica, sans-serif" size="2"></font></td> <td colspan="3"> <div align="center"> <font face="Arial, Helvetica, sans-serif" size="2"><b><font color="#FFFFFF">% change June 2002-June 2003</font></b></font> </div> </td> </tr> <tr bordercolor="#CCCCCC"> <td><font face="Arial, Helvetica, sans-serif" size="2">Cladding and covering: aluminium</font></td> <td colspan="3"> <div align="center"><font face="Arial, Helvetica, sans-serif" size="2">–0.8</font></div> </td> </tr> <tr bordercolor="#CCCCCC"> <td><font face="Arial, Helvetica, sans-serif" size="2">Finishes: flexible tiles and sheet coverings</font></td> <td colspan="3"> <div align="center"><font face="Arial, Helvetica, sans-serif" size="2">–0.7</font></div> </td> </tr> </table>
Work categories displaying the highest cost increases are as follows: <table width="350" border="0"> <tr bgcolor="#000066"> <td><font face="Arial, Helvetica, sans-serif" size="2"></font></td> <td> <div align="center"><font face="Arial, Helvetica, sans-serif" size="2"><b><font color="#FFFFFF">% change June 2002-June 2003</font></b></font></div> </td> </tr> <tr> <td><font face="Arial, Helvetica, sans-serif" size="2">Pipes and accessories: clay and concrete</font></td> <td> <div align="center"><font face="Arial, Helvetica, sans-serif" size="2">+13.4</font></div> </td> </tr> <tr> <td><font face="Arial, Helvetica, sans-serif" size="2">Concrete: reinforcement</font></td> <td> <div align="center"><font face="Arial, Helvetica, sans-serif" size="2">+9.4</font></div> </td> </tr> <tr> <td><font face="Arial, Helvetica, sans-serif" size="2">Metal: decking</font></td> <td> <div align="center"><font face="Arial, Helvetica, sans-serif" size="2">+8.0</font></div> </td> </tr> <tr> <td><font face="Arial, Helvetica, sans-serif" size="2">Piling: concrete</font></td> <td> <div align="center"><font face="Arial, Helvetica, sans-serif" size="2">+6.9</font></div> </td> </tr> <tr> <td><font face="Arial, Helvetica, sans-serif" size="2">Concrete: in situ </font></td> <td> <div align="center"><font face="Arial, Helvetica, sans-serif" size="2">+6.8</font></div> </td> </tr> <tr> <td><font face="Arial, Helvetica, sans-serif" size="2">Pavings: coated macadam and asphalt</font></td> <td> <div align="center"><font face="Arial, Helvetica, sans-serif" size="2">+6.8</font></div> </td> </tr> <tr> <td><font face="Arial, Helvetica, sans-serif" size="2">Cladding and covering: coated steel</font></td> <td> <div align="center"><font face="Arial, Helvetica, sans-serif" size="2">+5.9</font></div> </td> </tr> <tr> <td><font face="Arial, Helvetica, sans-serif" size="2">Waterproofing: asphalt</font></td> <td> <div align="center"><font face="Arial, Helvetica, sans-serif" size="2">+5.8</font></div> </td> </tr> <tr> <td><font face="Arial, Helvetica, sans-serif" size="2">Site planting</font></td> <td> <div align="center"><font face="Arial, Helvetica, sans-serif" size="2">+5.8</font></div> </td> </tr> <tr> <td><font face="Arial, Helvetica, sans-serif" size="2">Raised access floors</font></td> <td> <div align="center"><font face="Arial, Helvetica, sans-serif" size="2">+5.6</font></div> </td> </tr> </table> Many of these increases are attributable to the knock-on effect of the introduction of the aggregates levy on 1 April 2002, subsequently leading to price increases in concrete, precast concrete products and macadam. The increase in reinforcement costs noted above is related to the supply difficulties that arose last year after ASW went into receivership. <b><font size="+2">Labour rates</font></b>
<b>Construction Industry Joint Council</b>
A new three-year agreement on pay and conditions began on 30 June 2003. The three-part deal, in annual increments, will lift basic wage rates for craft and general operatives 23% overall. Previous agreements had widened the margin between rates of pay for craft operatives and general operatives, but equal percentage increases will apply over the next three years. Intermediate skill rates also rise by the same percentages.
The first year of the deal raised basic rates of pay by 5.1%, to £5.77 per hour for a general operative and £7.67 for a craft operative. These rates are effective between 30 June 2003 and 27 June 2004. From 28 June 2004, the rates will rise by a further 7.1%.
This table illustrates how the basic rates of pay translate into "all-in" hourly rates of pay – that is, how much they will cost an employer. The assumptions and build-up follow the procedures used in Spon's Architects' and Builders' Price Book 2004.
The calculations are based on a working week of 44 hours – a 39 hours standard week and five hours overtime per week.
The resultant all-in hourly rates of £11.42 for a craft operative and £8.75 for a general operative do not include for any bonus arrangement that may operate.


No comments yet