Activity is still rising, although more slowly in some sectors, while orders and enquiries are also on the up – although repair and maintenance is losing momentum. The standout sector was civil engineering. Experian Economics reports
01 / State of play
The total activity index remains in positive territory after it gained one point over February’s figure to reach 55, the same as in December 2017. The repair and maintenance index continued to lose momentum in March as it dug further into negative territory. It lost another three points over the past month to stand at 46, a 10-month low.
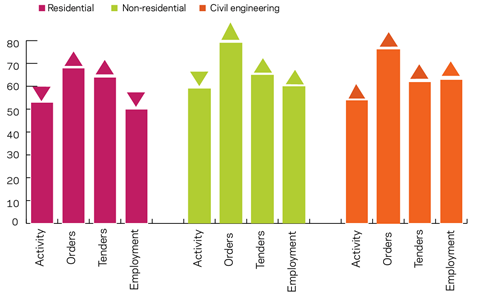
All sectoral indices were in positive territory in March, with civil engineering making a significant improvement over the month. The residential and non-residential activity indices both lost points – one and two, respectively – but continue to indicate growth with figures of 53 and 59. Civil engineering activity returned to positive territory, gaining 24 points to reach 54, close to January’s figure. This follows a plunge of a similar size just a month ago.
Both orders and tender enquiries gained four points each, pushing them further into positive territory. The orders index stood at 71 points while tender enquiries reached 62 points.
All sectors showed growth in orders, especially civil engineering, whose index gained 36 points to reach a 19-month high. Residential and non-residential orders indices gained one and three points to reach 68 and 79, respectively, adding to their long history of positive dynamics.
The non-residential tender enquries index recorded the highest figure of the three – up by four points to 65, followed by residential at 64 (up eight points) and civil engineering at 62 (up six points).
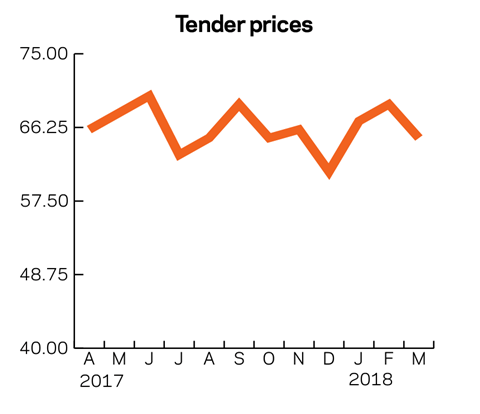
The tender prices index suggested a slowdown in growth, falling four points to 65, a three-month low – but the three-month average, however, is on the rise, underpinned by the positive dynamics in the index over the two months to February.
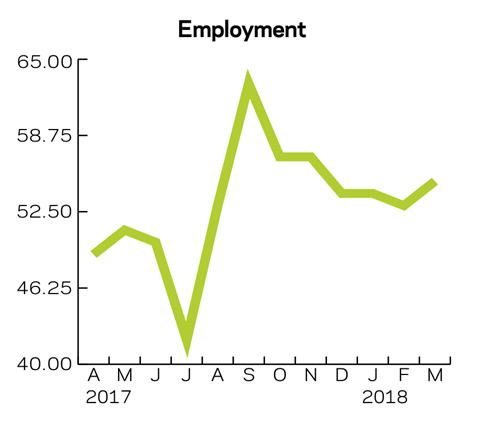
The employment prospects index remained in positive territory for its eighth month, picking up by two points to hit a four-month high of 55.
The percentage of respondents facing no constraints fell further over the past month, by eight percentage points to 24%.
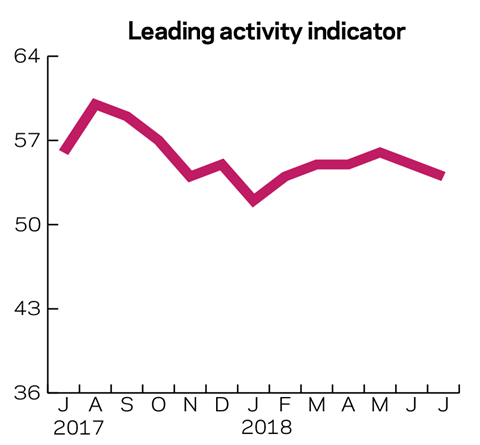
02 / Leading construction activity indicators
After the contractors’ activity index for March gained one point to stand at 55 points, the leading activity indicator is expected to keep its positive momentum initially then gradually lose some points in the following months, settling close to its current level.
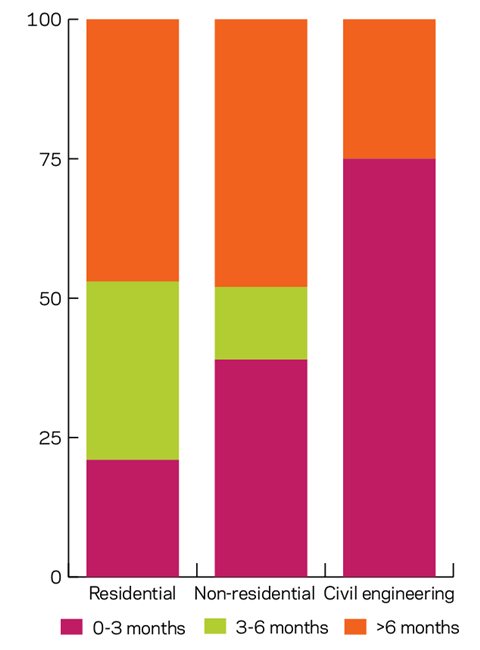
03 / Work in hand
The amount of work in hand in both the residential and non-residential sectors has shifted slightly towards longer periods of work being available. In the residential sector, the respondents reporting up to six months’ worth of work contracted by 12 percentage points to 53%. The share of agents reporting more than six months of work gained those 12 percentage points to reach 47%.
In the non-residential sector the gain in the share of those with work for longer than six months (which rose by 14 percentage points to 48%) was on the back of a decrease in both shares of those reporting work up to three months (down by two percentage points to 39%) and work available for three to six months (which showed a 12 percentage point drop to 13% of the respondents).
The levels of work in hand in the civil engineering sector exhibited similar developments. Work in hand for more than six months was reported by a fourth of the respondents, relative to none in December, whereas the proportion reporting work between three and six months fell to zero (compared with 17% in December). The remaining 75% (against 83% in December) of respondents reported work availability of up to three months.
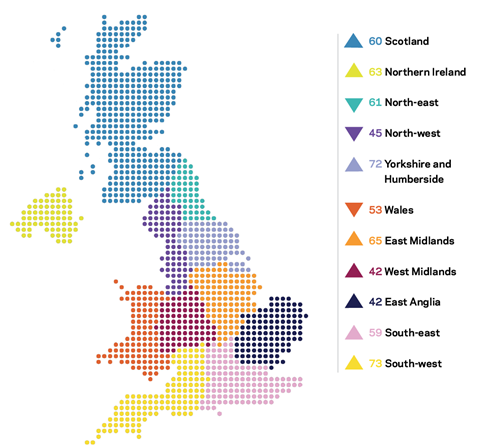
04 / Regional perspectives
Experian’s regional composite indices incorporate current activity levels, the state of order books and the level of tender enquiries received by contractors to provide a measure of strength for each region.
March saw one region return to positive and, along with seven others marking improvements in their indices, contributed to the positive development in the overall UK composite index, which gained three points last month to reach 52, close to January’s 53.
After three months in negative territory, the South-east gained 11 points to push its index over the no-growth bound to 59. Scotland and Northern Ireland remained in positive territory after recording rises of six and four points to 60 and 63 respectively.
Both Yorkshire and Humberside and the North-east fell behind the South-west, which overtook their indices of 72 and 61 by making a 12-point gain that pushed it to the leading position with 73. Wales’ index marked its largest drop since May 2017 – losing nine points to 53 and moving down to 8th position. Its previously occupied third position was taken by the East Midlands with an index of 65, up by three points.
The West Midlands remained in the negative despite a 13-point improvement but still shared last place with East Anglia at 42 points. The North-west was the third region settling in negative territory. Its index lost four points and stood at 45, marking its second month below the no-growth bound.
This an extract from the monthly Focus survey of construction activity undertaken by Experian Economics on behalf of the European commission as part of its suite of harmonised EU business surveys. The full survey results and further information on Experian Economics’ forecasts and services can be obtained by calling 0207-746 8217 or logging on to www.experian.co.uk/economics.
The survey is conducted monthly among 800 firms throughout the UK and the analysis is broken down by size of firm, sector of the industry and region. The results are weighted to reflect the size of respondents. As well as the results published in this extract, all of the monthly topics are available by sector, region and size of firm. In addition, quarterly questions seek information on materials costs, labour costs and work-in-hand.
1CFR’s Leading Construction Activity Indicator incorporates a range of factors to assess the construction industry’s prospects over the next quarter. The indicator is put together using information about past levels of activity, orders and tender enquiries.


No comments yet