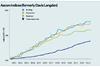
Construction output has a way to go to get back to pre-recession levels; materials prices aren’t going anywhere fast and steel is in free fall.

01/ Key changes

  • Construction output growth for the last two quarters has shown steady growth, rising 1.7% in 2013 Q3 with three consecutive months of growth for the first time since 2011
  • UK construction output is at its highest since September 2007 but is still below pre-recession levels by more than 10%
  • Growth in new housing sustains momentum with a 15% increase over last 12 months
  • Construction materials prices remain subdued during 2013 Q3
  • Steel price continues to fall as global demand sags
  • Consumer price index rose by 2.2% in the year to October, down from 2.7% in September

The following chart shows how Aecom’s index series, reflecting cost movements in different construction sectors, have fared since 2000, with the movement of the Consumer Prices Index for comparison.

Aecom graph

Percentage change year-on-year (Q4 2012 to Q4 2013)

 %Direction
Building Cost Index+2.0
Mechanical Cost Index+1.8
Electrical Cost Index+1.1
Consumer Prices Index+2.2

2013 Q4 figures provisional. Consumer Price Index @ October 2013.

Building cost index
There has been a 2% increase in the index over the last 12 months with a 0.1% increase between the last two quarters.

Mechanical cost index
The Mechanical index shows a 1.8% increase over the last 12 months with no noticeable change between the last two quarters.

Electrical cost index
Year-on-year increase of 1% is lower than for the previous Cost Update published in August 2013, but reflects a 1.4% increase between quarters.

Consumer prices index
The index rose by 0.1% between September and October 2013 leading to a fall of 2.2% over the 12 months to October. Reduced transport costs were the main contributor to the reduction as petrol prices fell by almost 5 pence per litre between September and October.

Guide to data

Aecom’s cost indices track movements in the input costs of construction work in various sectors, incorporating national wage agreements and changes in materials prices as measured by government index series. They provide an underlying indication of price changes and differential movements in the various work sectors but do not reflect changes in market conditions affecting profit and overheads provisions, site wage rates, bonuses or materials price discounts/premiums. Market conditions are recorded in Aecom’s quarterly Market Forecast (last published 1 November).

02/ Price adjustment formulae for construction contracts

Price adjustment formulae indices, compiled by the Building Cost Information Service (previously by the Department for Business, Innovation and Skills), are designed for the calculation of increased costs on fluctuating or variation of price contracts. They provide useful guidance on cost changes in various trades and industry sectors and on the differential movement of work sections in Spon’s Price Books.

Over the last 12 months between October 2012 and October 2013, the 60 building work categories recorded an average rise of 1.1%, down marginally from the 1.2% reported three months ago.

Of the 60 work categories published, 47 categories show a price increase and eight a price fall over the last 12 months, with an average increase of 1.1%.

The largest price increases over the last 12 months have been in the following work categories:

Oct 2012 - Oct 2013% change
Softwood carcassing and structural members3.1%
Pavings: Coated macadam and asphalt2.9%
Finishes: Flexible tiles and sheet coverings2.8%
Sanitary appliances2.8%
Waterproofing: Asphalt2.8%
Boards, fittings and trims: manufactured2.6%

The largest fallers are:

Oct 2012 - Oct 2013% change
Finishes: bitumen, resin and rubber latex flooring-5.1%
Insulation-3.6%
Pipes and accessories: copper-2.2%
Piling: steel-2.0%
Metal: miscellaneous-1.3%
Pipes and accessories: spun and cast iron-1.2%

03/ Executive summary

  • Industry input costs rise ▲
  • Industry output prices rise 0.8% in the year to October ▲
  • Construction materials prices subdued ►
  • Metals prices fall ▼
  • Imported materials as a whole rose 1.1% in July ▲
  • Steel prices continue decline ▼
  • Rate of consumer price inflation falls ▼

04 / key indicators

Consumer prices Oct 2013% changeDirection
Consumer Prices Index (CPI)+2.2

The annual rate in October fell to 2.2% from 2.7% in August.

Industry input costs

The total input price fell by 0.3% following a rise of 0.9% in the year to October.

 % changeDirection
Materials and fuels purchased by manufacturing industry-0.3
Materials and fuels purchased by manufacturing industry excluding food, beverages, tobacco and petroleum industries-0.4

Key price movements over the last 12 months to October have been:

 % changeDirection
Electricity+4.9
Gas+3.2
Imported metals-7.1
Imported glass and glass products+2.7
Imported wood and wood products+1.2

Industry output prices

Factory gate inflation now stands at 0.8% for the year and is currently at its lowest level since October 2009. It has been reducing since July 2013.

 % change Oct 2012 - Oct 2013Direction
Output prices of all manufactured products+0.8
Output prices of manufactured products excluding food, beverages, tobacco and petroleum+0.9

Metals prices continue to fall back quite sharply as concerns grow over the economic slowdown in China, the top buyer of base metals.

Metal prices% change Oct 2012 - Oct 2013Direction
Copper-10.4
Aluminium-7.52
Lead0.7
Zinc0.7
Nickel-15.8
Exchange ratesOct 2012 averageOct 2013 average% change
£ to Euro1.23931.1797-4.8
£ to $1.60791.60940.1

The strengthening of the pound over recent months is a reflection of the UKs economic recovery gaining momentum.

The fall in £/$ between July and August shows a short-term weakening of the Dollar against Sterling, although the long term trend shows a strengthening of the Dollar against Sterling.

Construction industry

Materials price increases for the construction industry over the last 12 months are detailed below:

 % change Sept 2012 - Sept 2013Direction
Construction materials generally:  
New housing+0.8
Non-housing new work+0.6
Repair and maintenance+0.5

Some increase in construction materials prices at the beginning of the year, particularly for new housing and repair and maintenance, which show an increase over 1% but, year on year, prices are still relatively subdued.

Mechanical services materials% change Sept 2012-Sept 2013Direction
Housing only0.00
Non-housing-0.50
Electrical services materials-2.0

Mechanical and electrical materials prices have fallen a little over the year but are generally stable.

A few materials have shown above or below average price movement over the last year:

 % change Sep 2012 - Sep 2013
+Particle board+4.5
Imported sawn or planed wood+3.6
Sand and gravel+3.2
Plastic pipes and fittings (flexible)+2.6
Paint (aqueous)+2.3
Crushed rock-3.7
Fabricated structural steel-5.6

(Data sources: ONS and BIS)
(*Sep 2013 figures provisional)

05 / Labour market statistics

  • Construction workers’ average weekly total pay for 2013 Q3 was £552
  • Average total pay for all employees in Great Britain was £475 per week
  • For Q2 2013 there were 2,006 million people working in construction, an increase of 0.7% over the previous quarter.

06 / Wage agreements

The three main construction unions and employees are currently negotiating wage agreements for the next three years.

The initial offer, which would cover 500,000 workers under the national wage agreement, breaks down as a 1% rise in January, followed by 1% in September 2014 and then 2.5% in 2015. We need to wait to see the final outcome of the negotiations.

Building and Allied Trades

BATJIC agreed new wage rates which came into effect on 17 June 2013 and run to 15 June 2014.

The 2013/14 agreement involves a 2% increase in pay. The rise is across the board except for the hourly rate for the adult general operative which increases by 3% from £7.96 to £8.20 per hour. There are also improvements in the death benefit scheme, which increases to £25,000, and statutory sick pay rises to £119 per week.

The new BATJIC rates of wages are:

Standard rates of pay for 39 hrs per weekPer weekPer hour
S/NVQ3: Advanced£426.66£10.94
S/NVQ2: Intermediate£366.60£9.40
Adult General Operative£319.80£8.20
For entrants aged 19 years and over  
• Third 12 months with NVQ2£344.37£8.83
• Third 12 months without NVQ£299.52£7.68
Apprentices under 19 years of age  
• 18 years of age with NVQ2£299.52£7.68
• 18 years of age without NVQ2£283.14£7.26

Wage agreement summary

The following table summarises the wage agreements currently in force for the principal wage fixing bodies within the construction industry.

OperativesAgreement bodyCurrent basic hourly rateEffective sinceDetails inDate of next review
Buildings and civil engineering operativesConstruction Industry Joint CouncilCraft rate: £10.67 / hour7 Jan 2013Cost Update 1 Mar 2013Not before 2 Jan 2014
 Building and Allied Trades Joint Industrial Council (BATJIC)S/NVQ3 advanced craft: £10.94 / hour17 Jun 2013Spon’s Architects’ and Builders’ Price Book 2014Agreement until 15 Jun 2014
PlumbersThe Joint Industry Board for Plumbing Mechanical Services in England and WalesAdvanced plumber: £13.50 / hour2 Jan 2012Spon’s Architects’ and Builders’ Price Book 2014Expected 7 Jan 2013 - discussions continue
 Scottish and Northern Ireland Joint Industry Board for the Plumbing IndustryAdvanced plumber: £12.89 / hour6 Jun 2011Spon’s Architects’ and Builders’ Price Book 2014 / Cost Update 27 May 2011Negotiations ongoing for 2013-14
H&V operativesJoint Conciliation Committee of the Heating, Ventilating and Domestic Engineering IndustryCraftsman: £11.55 / hour1 Apr 2013Spon’s Architects’ and Builders’ Price Book 20147 Apr 2014
ElectriciansThe Joint Industry Board for the Electrical Contracting Industry/Scottish Joint Industry Board for the Electrical Contracting IndustryApproved electrician: £14.57 / hour (own transport)7 Jan 2013Cost Update 1 Mar 20136 Jan 2014