


Encouraged by our achievements in the first month of CIBSE’s 100 Days of Carbon Clean-up campaign, the BSJ office called in the experts to give our building an energy asset rating. That soon brought us back down to earth
We’re now two-thirds of the way through CIBSE’s 100 Days of Carbon Clean-up campaign and here at Ludgate House, where BSJ is based, we’ve made some significant inroads into cutting our carbon emissions. During June alone, we saved 11,142 kWh of electricity compared to May, which is equivalent to 4791 kg of CO2, and there is more to come.
Most of these ‘quick wins’ have been made by raising awareness about the issues surrounding carbon emissions and getting people to change their attitudes.
The ultimate aim of the campaign is to cut the carbon emissions of existing buildings without making a huge capital outlay, but this is intended as just the beginning. Is there more we could be doing – and what are the most cost-effective measures? To find out, BSJ commissioned John Field, energy management director of Power Efficiency, to assess the efficiency of Ludgate House and suggest improvements.
To make the audit more interesting, we decided to come up with an energy asset rating for the building, similar to that which might be implemented by the European Directive for the Energy Performance of Buildings.
Under the EU directive, all buildings, when they are let or sold, must have a certificate that gives them an energy rating between A and G, with A being the most efficient, G the least.
Although the government has yet to announce how these ‘asset ratings’ will be determined, the most likely method is the Simplified Building Energy Model (SBEM) devised for showing compliance with the current Part L of the Building Regulations.
SBEM-based ratings
Power Efficiency is the only firm we came across that offers a trial rating of existing buildings using SBEM. The asset rating is based on the form, structure and servicing of the building and not its actual occupancy patterns or metered energy use. It is determined by comparing the existing building to a notional building that complies with the 2002 Part L regulations. The notional building is given an efficiency of 100% – so a building with a score of less than 100% performs better than the notional building while one with greater performs worse.
First off, Field, who is also chairman of CIBSE’s carbon taskforce and vice chairman of its energy performance group, visited the building to meet with Stephen Vause, head of facilities and Dermot Hughes, the building manager, to gather the information needed for the SBEM calculation.
This can be quite an onerous task for existing buildings, particularly older ones, where original drawings and O&M manuals might have long disappeared. For example, SBEM needs the power input and rate of airflow to calculate the fan efficiency – there are almost 50 fans in Ludgate House.
The process is made even more time consuming with the changes introduced to SBEM around March of this year to properly account for the effects of even moderate glazing. Floors must now be separated into zones for core spaces and for 6 m perimeter zones for each glazed wall-orientation (eg west facing) and corner-zones (eg north-and-west facing). With the increased data needed, there is a greater chance for errors to creep in.
“Up to March, you could do a whole floor of open plan office-space as a single zone,” says Field. “It’s nearly an order of magnitude difference in the amount of information and I think, sadly, this will be a real issue in the take-up of SBEM with the standard iSBEM interface." There are possible solutions, which involve using iSBEM’s ‘Zone multiplier’ and ‘Record copy’ options.
After running the figures through the software, Field came up with a rating for Ludgate House and the notional building expressed as kWh of energy use and the associated kg of CO2 emissions per square metre of floor area.
The moment of truth
The overall rating is 155%, indicating that the building has CO2 emissions 55% higher than the notional building based on the 2002 Part L requirements. The big question is – where would this put it on the A to G scale?
Although there isn’t an official grading scheme in place yet, it would probably be equivalent to an E. Field has based this on the draft CEN proposals, in which a building at the bottom of the B band (just better than a C) correlates with current Building Regulations standards – meeting the Target CO2 Emission Rate for compliance with the 2006 Part L (see box, far right, on the grading system).
Did the rating surprise Vause and Hughes? “Yes and no,” says Hughes. “We knew the age of the building, so obviously compared to the 2002 Part L regulations it was going to fall short. However, we were disappointed that it didn’t perform better and that certain improvements we had made recently weren’t taken into account by the SBEM model.”
Hughes is referring in particular here to improvements made last year to the lifts, including new controls and regenerative drives.
According to Field, lifts aren’t taken into account in the calculation, “It’s probably something they didn’t get around to including,” he says. Lifts are not currently subject to Part L, despite the fact that they can be responsible for using anywhere between 5% and 15% of a building’s energy consumption.
Over the last year Field has carried out similar Asset Rating audits on around a dozen buildings. Most of these have returned results of around 140-150%. Ludgate is the second he’s inspected that has a VAV system.
However, he does admit that he expected a better result here and suspects that the building probably does perform better than the rating suggest. He explains that more time – in this instance he didn’t have as much time as he’d normally spend on a audit – needs to be spent establishing parameters such as the average seasonal efficiency figures for the boilers and the performance of the chillers as the default values for these are unfavourable.
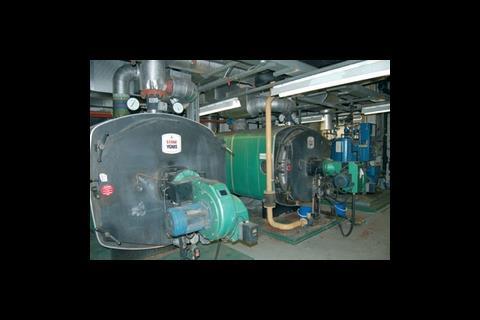
For example, the default generator for seasonal efficiency for the boilers is very low 65%, but if it can be shown that it was installed after 1998 the default efficiency jumps to 81% and if it appears on the ECA list (after 2001) it rises to 89%, which can make a significant difference.
Potential for improvement
With this in mind, Vause and Hughes went back and unearthed additional data on the glazing and boilers. These were then used by Field in his 10-step plan to see what effect certain improvements would have on the building’s rating as well as a rough estimate on the cost and practicality of carrying them out (Ten Steps to a Better Rating, right). These steps were chosen as the ones most applicable to a building of this type.
The biggest potential comes from passing the leakage tests for the ductwork and air handling units. When Ludgate House was built, this wouldn’t have been a requirement but it could deliver a massive 17% improvement. Similarly, establishing the performance of the cooling plant could deliver a 16% improvement. Together, these measures could move the building into a band D.
Another easy win is the installation of system energy metering and alarms. On Ludgate House, this could deliver a 5% improvement and would be relatively inexpensive. And under the new part L, metering must be installed when modifications are carried out on a building.
The least benefit comes from the use of air extracting luminaries, which, says Field, make little difference and would be very expensive to retrofit. Improving the U-value of the solid areas of the facade also has little discernable effect. Similarly any work to improve the glazing has extremely high cost for little benefit.
Carrying out a pressure test on the building could potentially lead to an improvement on the overall rating – however, the cost of this could be anything between £5000 and £10,000 and Field points out you might find the building leaks badly and the cost of sealing it would probably be very high.
Taking into account all 10 of the suggested improvements, the rating for Ludgate could, at 93%, be brought well within the C band, below that of the nominal building.
A worthwhile exercise
Although not all the measures are necessarily cost effective for a building of this age Hughes says the exercise was worthwhile. “It’s been a good starting point and provided us with an opportunity to understand what we need to do to improve the rating.”
Vause rules out doing a pressure test on the building, saying it would be expensive, disruptive and that remedial work to reduce permeability would be difficult.
However, depending on capital and lifecycle costs, upgrades to more energy efficient lighting are pending as some of the floors come up for refits and in the meantime, says Hughes, they are going to look at the control strategy. “The lighting is run on time switches with no separate user or daylight control for the perimeter lighting. We will look at reprogramming controls to allow the perimeter fittings to be switched off with occupant override.”
Two of the chillers are also due an upgrade and this might provide the opportunity to replace them with more efficient units.
Hughes says they have also looked at other measures, such as installing photovoltaic panels on the roof to supply a proportion of the building’s electricity load – but the payback period was 33 years, which ruled it out.
In the meantime, Hughes is determined to use CIBSE’s 100 Days of Carbon Clean-up campaign to continue to raise awareness about reducing energy use among the building’s tenants. “After all, reducing the energy demand is a good place to start.”
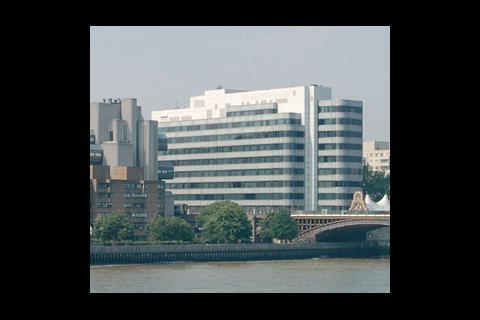
About Ludgate House
Ludgate House, where BSj is based, is typical of many offices that will come under scrutiny when building labelling arrives. Built in 1989, it is a typical multi-tenanted 11-storey building. Shallow in plan with no atrium, it has a net lettable area of 16,257 m² and gross floor area of 24,154 m².
The lower ground floor contains a loading bay, computer and plant rooms. The ground floor contains the reception, canteen and some occupied spaces; above this are eight floors of open plan office accommodation arranged around three cores. The top floor contains meeting rooms and above this are more plant rooms.
The building is clad in alternating bands of tinted double-glazed units, with a U-value of 2.8 Wm²/K and solid granite panels.
Heating and cooling is supplied using a full twin-duct variable air volume air conditioning system. The system is run from 6 am to 6.30 pm providing 8–15 litres/s/person. There is no heat recovery – although there is 50% recirculation.
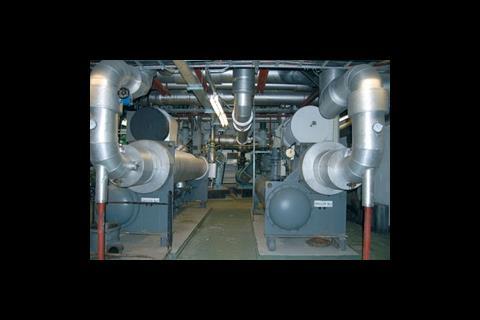
Cooling is supplied by two 1500 kW chillers and two 606 kW chillers with heat and hot water supplied by three gas-fired boilers.
The grading system explained
The government has yet to announce the grading system that will be used for EPBD certification of commercial buildings. Instead, we have had to generate a possible grading system with reference to draft CEN proposals, in which a building at the bottom of the B band (just better than a C) correlates with current Building Regulations standards - meeting the Target CO2 Emission Rate for compliance with the 2006 Part L.
For Ludgate House, the Target Emission Rate is 51.35 kgCO2/m² – this is the CO2 emissions of the Notional Building reduced by 20% for energy efficiency and then 10% for low/zero carbon [the low/zero carbon reduction must be applied to obtain the target but it may be achieved by energy efficiency measures] – ie a 28% overall reduction.
In other words the Asset Rating, which is the actual building emissions as a percentage of the notional building emissions, would need to be no more than 72% to gain Part L new-build carbon rating compliance - putting it at the bottom of the grade B band.
Under this system, an A-graded building can be expected to be half of this – ie 36% of the Asset Rating or better. Similarly, the other ratings are divided into band widths of 36%.
GRADE A Asset Rating must be at/less than 36%
GRADE B Asset Rating must be at/less than 72% (Complies Part L2A Carbon emissions)
GRADE C Asset Rating must be at/less than 108%
GRADE D Asset Rating must be at/less than 144%
GRADE E Asset Rating must be at/less than 180%
GRADE F Asset Rating must be at/less than 216%
GRADE G Everything above 216%
Ten steps to a better rating
Step 1 Glazing U-value improved from the default setting of 4.0 Wm²/K to 2.8 Wm²/K. Overall improvement on base case 2%. “Any work on glazing has extremely high cost for little benefit – zero cost benefit,” says John Field.
Step 2 Boiler efficiency improvement from the default setting of 0.65 to 0.7. Overall improvement on base case 3%. The non-domestic heating, cooling and ventilation compliance guide gives useful information on establishing what this could be.
Step 3 Wall U-value improved from 0.6 to 0.5 Wm²/K. Overall improvement on base case 1%.
Step 4 Air permeability improved from 10 m³/h/m² to 5 m³/h/m². Overall improvement on base case 8%. “A test would be required to establish the initial value, this may cost in the order of £5000 to £10,000. Depending on the findings it could cost another £10,000 for basic sealing measures.
Step 5 System air leakage tests. Overall improvement on base case 17%. “Again the tests, one set for ductwork and one for AHUs, would cost around £10,000 each. Leakage measures may be needed before or after which may double the cost.”
Step 6 System energy metering with alarms. Overall improvement on base case 5%. “This is likely to require system metering (90% of energy use will be allocated to the various services systems) plus a system of targets and alarm values. The cost of the metering would be around £10,000 minimum and the alarm system £5000.”
Step 7 Light fittings upgraded to high frequency with triphosphor lamps (these have already been fitted on three floors as part of a refit carried out when previous tenants moved out). Overall improvement on base case 8%. “Conversion costs could be checked but a minimum of £30 per fitting would give a total of £60,000 for 2000 fittings for the majority of the building – reduced by the 30% already completed.”
Step 8 Use of air extracting luminaries. Overall improvement on base case 1%. “It makes little difference and would be very expensive to retrofit.”
Step 9 Improving the efficiency of the cooling plant from a CoP of 2.5 to 3. Overall improvement on base case 16%. “This is the seasonal average CoP of the chillers. The default value for medium and large chillers is 2.5, but a value of 3 might be justifiable with more investigation and, say, evidence from the manufacturer.”
Step 10 Improving the specific fan power from 3 to 2. Overall improvement on base case 9%. “This is the W/litre/s of air supplied. The default value is high (bad) at 3 but the analysis does not provide any basis for reducing this. Replacing the 50 fans at say £4000 each would cost around £200,000.”
Downloads
Source
Building Sustainable Design

No comments yet