


With demand outstripping supply, selectivity was the dominant theme for contractors this year. And a failure to attract tenderers led to more creative approaches to procurement. But will these changes be lasting or is this just the current stage of a cyclical process?
01 / Executive summary
Tender price index ▲
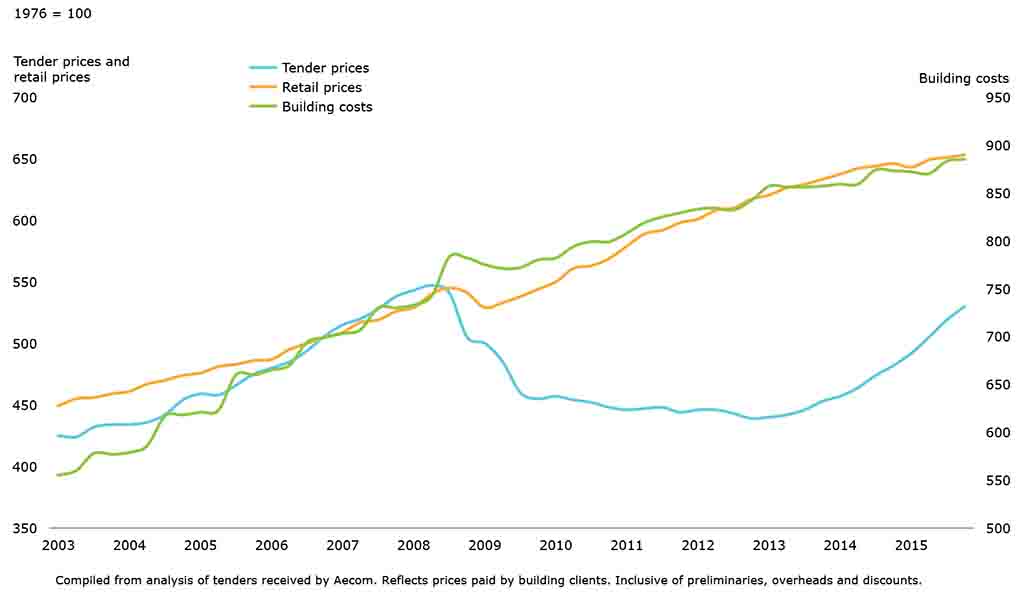
Tender prices continued their brisk rise, increasing to 9.5% provisionally on an annual basis in Q3 2015. This is the fastest pace of price increases since 2002.
Building cost index ▲
Building costs showed no sign of diverging from recent trends of 1% on the year at Q3 2015. Aecom’s building cost index is a composite of materials and labour costs, where they are broadly acting to offset each other.
Retail prices index ▲
The annual rate of change was 1.1% in Q3 2015. Although still positive overall, low inflation is expected to continue into 2016.
02 / Trends and forecasts
Selectivity remained the dominant theme for main and trade contractors throughout 2015. This was while enquiries and new orders flowed strongly. Market conditions around the country followed similar trends.
Feedback from every region confirmed the common trend for contractors to decline complex work while more straightforward, less risky, opportunities proliferated. Further, commercial positions changed significantly among all the major contractors with regard to overheads and profit and allowances for risk.
Extra tendering time was more frequently requested, a higher number of projects were negotiated rather than tendered, along with a general reluctance to tender due to the time and cost involved. Difficulties in attracting tenderers resulted in the need for packaging work or using more creative procurement approaches.
But the summer brought the first signs of a shift in mood among main contractors. Like the seasons coming around again, the idea of single-stage tendering or anything other than a negotiated procurement route is no longer unspeakable. The increasingly common complaint with a negotiated or a two-stage tendered approach is that it can take too long to reach a contract agreement.
While theory suggests that these procurement routes can achieve a better outcome and risk apportionment, they don’t always help constructors’ cash flow. Seemingly, there is a growing preference to get to site, get building and receive the money, which shorter procurement routes such as single-stage tendering enable.
A change in the rate of new orders for main contractors and an increasing scale of uncertainty about medium to longer-term pipelines of work may have introduced a slightly softer approach to market engagement. Certain caveats are still attached to engaging a single-stage tendering approach but changes to the outlook could yet modify this view further as more competitive pressure returns next year.
These insights might seem at odds with “nowcasting” and assessments of current activity. However, these are the early indicators of what will likely happen next year to headline output levels, given that main contractors procure first and then buy later the necessary trades and inputs for a project.
There are still firm views around in respect of procurement approach and engagement, particularly among those with fuller forward order books. However, initial glimpses of changing sentiment are perhaps necessary as client price elasticities were being tested by the continuing trend of increasing prices. Nonetheless, as clients balk at the prospect of accepting recent tender returns, constructors will doubtless wonder how far prices can be pushed up without impacting the likelihood of project starts.
Yet higher supply chain prices are the very thing which is eroding main contractor margins. Main contractors are snookered somewhat between supply chain pressure and client willingness to pay perceived lofty prices.
The last 18 months of sustained activity still does not answer the question of whether this is a rebound in activity or a sustainable recovery over the medium and long-term. Nonetheless, increased cyclicality in the industry is very likely to be the noticeable outcome over this and future periods. If higher prices are not to become self-defeating and ultimately damaging to overall output in the medium-term, there should be complementary developments and investment in skills, apprenticeships and training.
Recently announced government pledges to substantially increase housebuilding and associated targets might therefore end up like a mirage: a source of industry hope in the distance but ultimately unattainable. Furthermore, in the absence of compelling increases to industry numbers, tender prices will continue to rise significantly over the medium to longer-term, assuming workload and new orders are not materially changed.
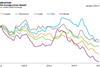
A / Inflation indices: Tender prices, building costs, retail prices
03 / Activity indicators
Recently published construction output data by the Office for National Statistics (ONS) saw a fall in all work (new work, as well as repair and maintenance) of 1.3% on a yearly basis at August 2015, yet the data posted an increase in new work of 3.1% over the same period (in constant prices).
Fluctuation in monthly data movements therefore continues. Despite this volatility, the data set comprises a large survey sample and arguably yields sound insights into underlying trends in the construction sector. Removing noise in the ONS data and attempting to mitigate its perceived volatility, rolling quarterly averages recorded similar trends to those at a monthly level, albeit with smaller percentage changes.
Non-housing sectors are beginning to contribute more to overall output, just as housing activity moderates. Output changes are particularly acute in public sector housing, seeing a 29% yearly decline in August (in constant prices).
Construction output excluding housing increased in excess of 8% year-on-year. That said, it is still not enough to offset overall output changes posted in August. This underlines the effect of the housing sector’s influence on recent industry conditions.
Looking at the data in more detail reveals the changing fortunes of sector activity. New infrastructure work has increased strongly in the last year, posting a yearly change exceeding 31% in August. It now accounts for just under a quarter of all new industry work, up from around 17% a year ago. Although the base effects play a part in the yearly change calculation, it is more likely to do with much greater volumes of infrastructure workload emerging in the sector.
The commercial sector, specifically in London, is set to contribute sound construction growth over the next two years. This expected rise in office construction is the response to demand for new space in London, on the back of positive UK economic developments. Rising rents make the fundamentals for office construction tenable, with rental growth in London predicted to improve further still. Declining availability and rising City and West End rents both support the supply and demand sides of the market. Further tender price pressure can be expected in London as a result of this increase in demand.
All recent published surveys of construction activity remain clear-cut: the industry is still buoyant, although conclusions are generally less unequivocal than recent history. The Chartered Institute of Procurement & Supply’s latest UK Purchasing Managers index sought to reverse its 2015 trend by posting 59.9 in September. This is soundly above its long-run average of approximately 54 but below its recent peak last year at a shade above 64.
The volume of new orders obtained by main contractors maintained a steady rate according to ONS data too. This should translate into favourable output figures over the coming quarters.
Forecasts for construction work over coming years are still positive, although output growth is not expected to be as frenetic as the near double-digit increases seen in the last 12 months. Experian’s market view remains optimistic with 3.6% and 4.3% UK construction output growth expected for 2016 and 2017 respectively.
B/ New construction orders

04 / Building costs and prices
Despite annual consumer price inflation turning negative again, tender prices continue to rise strongly. Aecom’s Tender Price Index shows that building price inflation in Greater London accelerated once again in the first half of 2015, increasing at the fastest rate since 2002 as the construction industry remained in bullish mood. More than this, many price metrics have surpassed those of 2008.
Tender prices increased 8.8% on the year in Q2 2015. Provisional figures for Q3 2015 indicate an annual change of 9.5% over the previous 12-month period. The increase in prices was underpinned by plenty of available work, a lack of capacity and strong labour cost increases (Q3 each year usually sees the implementation of wage awards). This is despite building materials price inflation posting much lower rates of annual change.
Though tender price increases have been remarkable, input cost trends have not moved to anywhere near the same degree. Building materials costs have increased by approximately 1% on average over the last 12 months. Brick prices generated many recent headlines but have levelled out, evidently responding to housing sector changes. Deeply negative cost trends for commodities and metals appear to have been captured much earlier in the construction value chain. Constructors assert that prices for components using metals commodity inputs have not dropped by commensurate amounts.
Wages continue to climb on the year, though there remains variability across trades. Generally, they are up 5-6% over the last 12 months, which is a slightly slower rate of average change than that seen earlier in 2015. But this slight adjustment to this yearly measure should not detract from the notable changes that have occurred to wage levels in the construction industry since the middle of 2013. Wage growth for many construction trades has significantly outperformed that of the wider economy. Demand for equipment operators is higher on increased infrastructure workload, with corresponding change to wage rates.
Preliminaries costs, overheads and profit and risk allowances have all responded to market conditions. Rising staff salaries and other labour costs for indirect construction cost elements have brought preliminaries percentages to 14% on average across the UK. Further, subcontractor preliminaries compound the trend of strong increases for indirect construction costs. Increased workload enabled contractors to concentrate on opportunities and procurement routes that better enabled a boost to margins.
Inflationary pressure across the supply chain is not likely to ease in coming quarters; all the while main contractors are still procuring and buying work. The circularity of price trends mean that busy subcontractors and suppliers will seek higher prices, with main contractors’ price levels in turn heavily influenced by those from their supply chain.
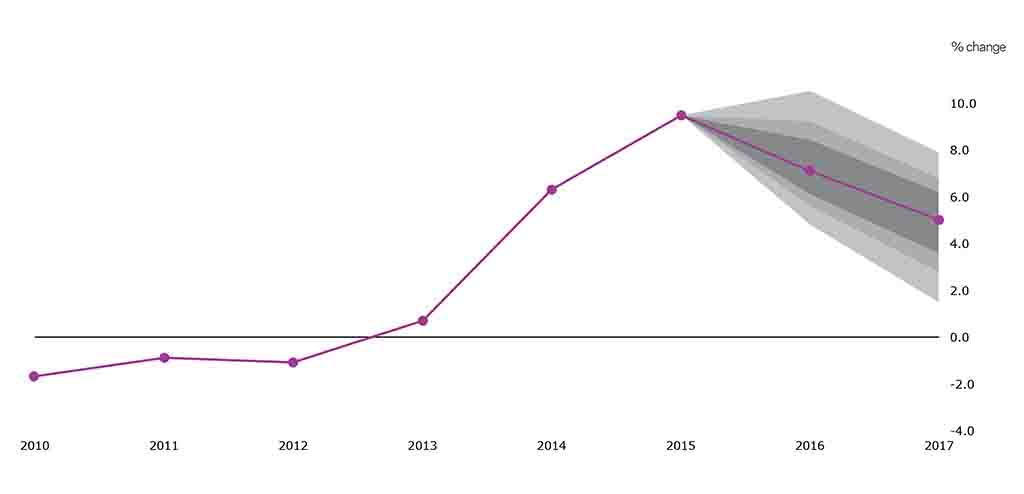
Using the same inflation forecasting methodology to that of the Bank of England and the International Monetary Fund, Aecom’s central forecasts for tender price inflation are 6.1% to 8.4% from Q3 2015 to Q3 2016, and 3.5% to 6.3% from Q3 2016 to Q3 2017.
Forecasts are inherently uncertain. Single or point forecasts represent only one possible future outcome. Different outcomes are entirely plausible, with varying degrees of probability. It is impossible to know the exact distribution of these future outcomes. Nevertheless, the fan chart (and its supporting methodology) facilitates an enhanced discussion in respect of risks over the forecast periods and to make an assessment of possible scenarios. It is more realistic therefore to recognise those uncertainties when outlining tender price inflation projections.
The fan chart highlights three key criteria: the baseline forecast for the current year and the following year; the level of uncertainty surrounding these forecasts; and where the balance of risks lie. Confidence intervals of 50, 70 and 90% are calculated, which, at the outer limits, represent the probability of tender price inflation expected to lie somewhere within the fan chart on 90 out of 100 occasions.
The balance of risks are assessed to be on the upside over the next 12 months, which is represented by an upside skew of the fan chart distribution. Similarly, the balance of risks over the period Q3 2016 to Q3 2017 is judged to be to the downside marginally, as uncertainties weigh on outlook. This results in a downside skew of the distribution of the confidence intervals around the central forecast for this latter period.
C / Aecom tender price index: Forecasts at Q3 on a year earlier

No comments yet