The construction activity indicator climbed eight points to hit its highest figure since June 2007, with activity rising in all three sectors.
01/ State of play
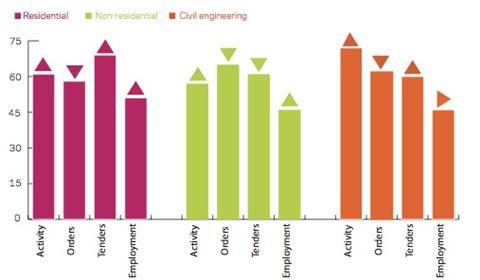
The construction activity index stood at 60 points in November, up eight points on the previous month, representing highest figure since June 2007. Activity rose in all three sectors, civil engineering saw the largest increase with a 13 point upswing to 72, the residential sector followed with an 11-point increase to 61. Non-residential construction edged upwards by three points to 57.
Following a peak of 69 in October, the orders index declined by 11 points to 58. However the tender enquiries index swung upwards to 61, with a 20 point increase.
The proportion of respondents indicating that insufficient demand was restricting activity increased slightly to 42%. The percentage of respondents indicating that they were experiencing no constraints on activity increased to 33% in November. In line with this the proportion indicating that bad weather and labour shortages were hampering activity both decreased from 7% to 3% this month. Financial constraints became less of a concern with 15% of respondents indicating their financial position was supressing activity. Meanwhile the proportion of respondents indicating material/equipment shortages were hampering activity levels remains unchanged at 3%.
The employment prospects index remains unchanged from October at 48. This indicates that businesses expect employment levels to decrease over the coming three months.
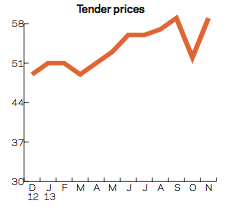
The tender prices index reached 59 in November, up seven points on the previous month. This indicates that firms are expecting the prices they charge to increase over the coming three months.
02/ Leading construction activity indicator
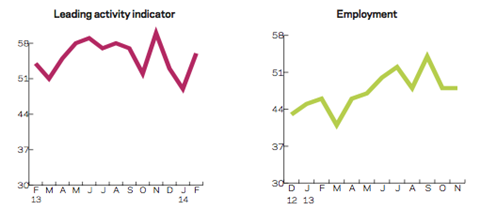
Experian’s CFR Leading Construction Indicator gained eight points last month to reach 60, the highest level recorded since June 2007. The Leading Construction Indicator is expected to fall below the no change threshold of 50 in January, before returning to positive territory in February.
The indicator uses a base level of 50: an index above that level indicates an increase in activity, below that level a decrease.
03/ Material costs
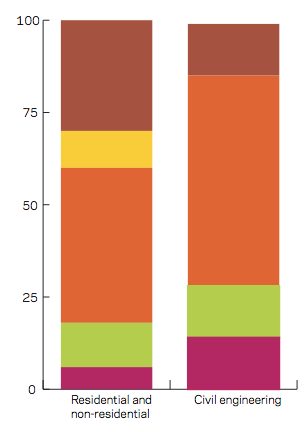
In November 6% of residential and non-residential firms reported that material costs had declined on an annual basis, down from 7% in August. The percentage of building firms indicating material cost inflation between 0% and 2.5% rose to 12%. The majority of respondents (42%) indicated that annual material costs have risen by between 2.6% and 5%, down from 59% three months ago. The percentage of building firms indicating material cost inflation of over 7.5% increased to 30% - an increase of 11% from August 2013.
04/ Regional perspectives
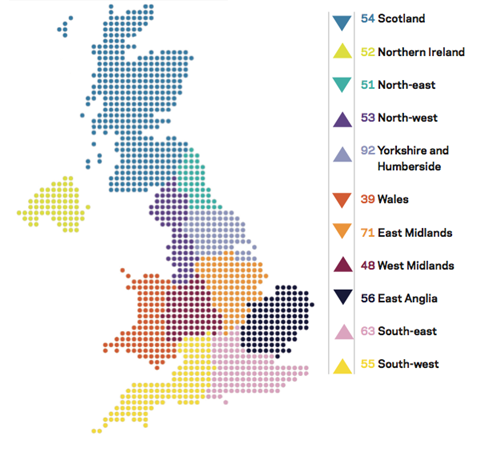
Six out of 11 regions and devolved nations saw an increase in their indices. Yorkshire and Humberside saw the largest regional upturn as its index climbed 15 points to reach 92 - the highest level since the survey began.
For the sixth consecutive month Northern Ireland saw its index increase; last month the series rose by two points to reach 52. The South-east and South-west also saw their indices rise, the former increasing by three points to 63, and the latter by five points to 55. Despite a four point uptick, West Midland’s index remains in negative territory for the fourth consecutive month at 48. The index for the North-west region climbed three points to reach 53; the highest index on record for the region.
The sharpest downturn was in East Anglia, as its index dropped eight points to 56. The North-east’s index declined by seven points to 51. Both Wales and the East Midlands indices declined by five points to 39 and 71 respectively. Scotland’s index contracted by three points to 54.
In August the UK index which includes firms working in five or more regions decreased by five points to 57.
This an extract from the monthly Focus survey of construction activity undertaken by Experian Economics on behalf of the European Commission as part of its suite of harmonised EU business surveys.
The full survey results and further information on Experian Economics’ forecasts and services can be obtained by calling 0207-746 8217 or logging on to www.experian.co.uk/economics
The survey is conducted monthly among 800 firms throughout the UK and the analysis is broken down by size of firm, sector of the industry and region. The results are weighted to reflect the size of respondents. As well as the results published in this extract, all of the monthly topics are available by sector, region and size of firm. In addition, quarterly questions seek information on materials costs, labour costs and work-in-hand.


No comments yet