London and New York are two of the world’s most successful cities for business. How does commercial property development compare between the two?

01 / Introduction
The “versus” in the title would suggest some sort of a battle and, of course, any global city is in competition with its peers to maintain its status on the world stage and sustain its prosperity. The building blocks of wealth are its infrastructure – its talent and its built environment, which in a way attract each other.
It is evident that in the big commercial centres of the US and UK the market really does rule, in the sense that the “rules” – legislation, regulation and guidance – have a profound influence on the buildings in which the talent works.
The debate on the UK’s future relationship with the European economy, which culminated in that vote a few weeks ago, frequently touched upon the impact of changing regulations and trade agreements, providing a stark reminder of how legislation, regulation and valuation can shape regional markets (as well as politics, social economics and infrastructure).
The London and New York office property sectors are good demonstrators of how responses to these respective constraints can define a product, its values and its prices.
In the following article Alinea Consulting, based in London, and its New York-based partner Dharam Consulting look at how these factors have played a part in shaping the cost and type of product that is a defining feature of these cities’ real estate – and how market dynamics might drive future trends.
02 / Rights or regulations? Building forms
Regulation shapes buildings quite literally but in different ways in each location. The bulk and mass of office forms in New York and London are largely outcomes of the planning or zoning system. New York is a rationalised grid layout with a planning system best summarised by its mantra “as of right”, where no discretionary action by the City Planning Commission is required so long as regulations are met.
Typically, the limiting factor on development is zoning requirements, generally defined through total permissible quantum (via maximum floor area ratio), ensuring the sky plane is respected and keeping within considerations such as preservation of the street face, podium elevation and material choice. So long as a developer complies with those requirements, it is permitted to build the total quantum of floor area.
London’s planning rules are less straightforward. London is a conglomerate of historic towns, which has created unusual site plots, and its planning rules often draw on regulatory compliance, third-party issues, heritage and quasi-democratic constraints.
Many buildings in London have adopted famously weird and wonderful forms, not just because of architectural imagination but due to the invisible “jelly mould” of constraints surrounding them.
Figure 1: Wall-to-floor ratios

Most photographs will illustrate how the more straightforward and understood restrictions of New York allow commerce to flourish, with little interference such that building masses are maximised. Its rectangular or “wedding cake” real estate is in contrast to the mix of profiles that impact London’s skyline.
This invisible hand and its moulding of articulated and irregular forms has a negative impact on wall-to-floor ratios, which are a key metric of cost efficiency. A wall-to-floor ratio of 0.50 means there is 50m2 of external wall for every 100m2 of gross internal floor area, so the lower the better. Not only are London’s wall-to-floor ratios generally higher but its range of wall-to-floor efficiencies is far greater because of its array of shapes.
Such variance in form is a significant driver of variance in cost, not only because of the greater extent of facade area, but because of the structural solutions that support these more shapely buildings, and the increased difficulty and time taken to construct them. Anything that attracts a moniker is likely to cost more – a “helter skelter” is bound to be less cost efficient than a “fridge”.
For these reasons, in terms of design economics, the principles of design that affects costs, New York is able to produce forms that are more commercially advantageous.
03 / The product: measurement and valuation
A grade A London office building has a well-defined brief stemming from the British Council for Offices, which has outlined preferential dimensions and specification guidelines since 1990. In the New York market, no such guide exists, ultimately driving a product that takes a more conservative view of what a developer should provide.
Expectations around a developer’s standard fit-out of office floors provides a good example of these differences. In London, a tenant expects a category A fit-out completed by the developer (which is usual) or an appropriate monetary amount in lieu. The purpose is to entice new tenants with partially fitted out space which should just require branch data, power, partitions, desks and so on.
In New York, the tenant will receive a space delivered to “cold shell” – no air handling plant, lighting or finishes and so on, as it is argued that these are tenant concerns.
This carries through to the levels of shell provided. For instance, in New York a tenant will be responsible for the fitting out of the lift lobbies and the installation of the air-handling primary plant for their demise.
The nuances of the “core and shell” (US) and “shell and core” (UK) provisions find their way into methods of valuation. The method of valuation in both cities relies on guidelines for net internal area measurement. In the UK, the (now superseded) Code of Measurement Practice 6 (COMP6) excludes washrooms and plant rooms from net internal area. However, New York’s method of area measurement from the Real Estate Board of New York (REBNY) and the countrywide Building Owners and Managers Association (BOMA) does allow for the inclusion of washrooms, common areas in floor and plant rooms within the net internal area calculation. The result is that the majority of the buildings in New York are designed to have on-floor tenant plant rooms. Therefore, under REBNY and BOMA standards, they have on-floor efficiencies in the 90% region with only vertical penetrations deducted.
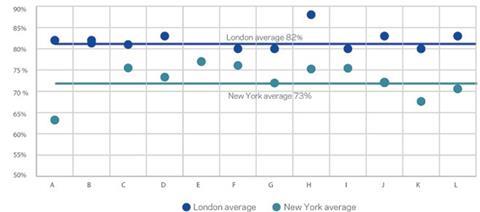
Under COMP6 rules, New York efficiencies are a lot lower, at 70-77%, which a London developer would accept on tower floors but not on mid to low rise offices where 80% plus is the expectation. As a New York developer can receive rent for tenanted on-floor plant rooms, less credence is paid to “tightening-up” cores by reducing riser space. To that end, whole air systems such as variable air volume (VAV) are preferred because the developer can put in base vents, chillers and so on, leaving more distribution for the tenant to install.
In London, because landlords do not receive a rental income on plant space, the preference is to use minimal air systems such as four-pipe fan coil or chilled beams, ensuring the risers take up less space, which keeps the cores “tight”.
Figure 2: On floor net-to-gross floor area efficiencies using UK rules

This graph illustrates the differences of New York and London floorplate efficiencies (referencing a selection of office projects in both cities) – using the UK rules as a common method of measurement
04 / Labour, labor and the state of the unions
Often at the heart of discussions on the differences between New York and other global construction markets is the extent of unionisation and how much cost it adds.
Why is unionisation so important a factor in New York? Aside from collective bargaining around wage structures, it provides a set of criteria for how works are to be carried out – how many operatives per work face for example. Some commentators see this as unproductive and a detriment to efficiency of both the speed of construction works and the cost of construction.
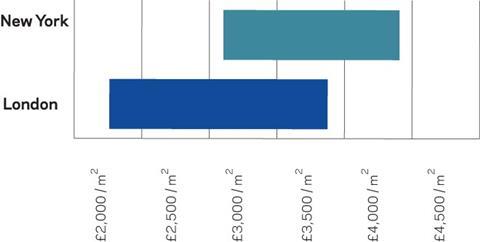
Given the benchmark range of commercial office construction costs exhibited in Figure 3, and the positive influence that design economics should have on New York’s buildings, then this view is understandable. If the forms are more efficient, then the relative cost of labour must surely play a key part in making New York’s buildings more expensive overall. Our research suggests this is the case.
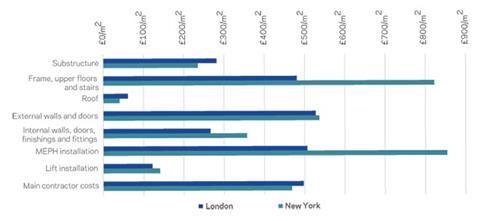
The banding is clearly higher and narrower in New York, and when we look at the average individual elements we can see where the real differences lie (Figure 4).
The elements that stand out are the frame construction and the mechanical and electrical services installations, which are known for being the most unionised in New York. In the case of the above this is on average 40% more than London. Using the example of steel subcontractors, Table 1 shows how this affects frame costs in New York and London (normalised to pound sterling per tonne).
At the outset both New York and London pay similar levels for their steel material. However, through manufacturing and then, even more so, through on-site erection, New York pays significantly more; over double, in fact. The wages themselves are higher, as shown in Table 2, but that is not the only reason.
A subcontractor working under union rules will also divide up its trade into a number of specialist subpackages. For structural steel, this may be a firm that installs the reinforcement or pours the concrete, resulting in an increased number of site operations, many of which spend time waiting for other specialists to finish before they start their work.
Once those trades are engaged their expertise carries them through quickly but that does not account for the amount of non-productive time spent on the project.
Conversely, London has benefited from the competition for wages in the London market from the rest of the EU; from Poland in the 1990s and early 2000s to Romanians and others in the current day – though this is clearly “hot” and topical following the Brexit vote on 23 June.
This has been coupled with the decline of union activity in the UK construction market. This was signalled in the previous decade by the decision of several smaller unions, including those representing some construction disciplines, to pool resources by being subsumed into the large Unite union.
Figure 3: Shell and core total £/m2

Table 1
| London (£/tonne) | New York (£/tonne) | |
|---|---|---|
| Material | 850 | 800 |
| Fabrication | 610 | 810 |
| Erection | 490 | 1,600 |
| 1,950 | 3,210 |
Table 2
| Operative | London £/hr | New York £/hr |
|---|---|---|
| General labourer | £15/hr | £55/hr |
| Structural steelworker | £40/hr | £85/hr |
| Machine operator | £35/hr | £75/hr |
| Carpenter | £35/hr | £70/hr |
| Electrician | £40/hr | £95/hr |
| Plumber | £40/hr | £70/hr |
Figure 4: Average element breakdown £/m2

05 / Thinking ahead
Future shapes
London’s planning policy could change more than New York’s over the next couple of years. The new London mayor, Sadiq Khan, will possibly subject future developments to greater scrutiny than his predecessor, perhaps because of the backlash from some controversial developments being approved through mayoral powers (though the need to encourage development is obvious now the UK is saying goodbye to the EU).
Finding a sensible middle ground will be especially important as current vacancy rates in Central London are at a 15 year low, highlighting the need for greater utilisation of existing development sites.
A common valuation
The move by the RICS and other global bodies to create an international method of measurement is a necessary albeit painful process. The list of members does not currently include REBNY but does include BOMA which, in time, could encourage greater similarity in building forms in terms of shell and core provisions, even if the external moulding of schemes is less affected. This means that eventually building forms of both sides of the Atlantic could become similar.
Additionally, the US-born WELL building standard is also becoming a new way of approaching design and setting an international market norm for how future occupants use their space and this is already in the thoughts of some UK developers.
This may in itself change the shape of floor plates and also how we measure net internal space, leading to secondary benefits such as greater recognition of low carbon buildings, which would be a big step forward for New York offices.
Free markets
The long-time bedrock of unionised labour in New York has come under threat in recent years following the rise of “open-shop” or non-union labour.
This has provided developers access to new, competitive labour pools, but there are still some questions over like-for-like quality and safety.
In the UK, the Brexit debate was partly won by the arguments for greater control over immigration. However, what is clear is that access to free movement of skilled labour is critical to keeping costs down.

06 / In summary
Both New York and London pay a “regulatory tax”, in effect a burden on costs and values that their respective planning regulations place on their commercial buildings.
London’s greater multiplicity of constraints, and interested parties, is a counterpoint to New York’s focus on “As of Right” straightforwardness. The latter encourages a simpler set of rectangular and “wedding cake” forms whereas London’s increasingly spectacular skyline pays the price in design-driven costs. However, the comparative benefit that New York’s cost-effective massing provides is lost by its high cost and relative inefficiency of labour – both of which are driven by the innate influence of its unions.
Perhaps more surprisingly, and less appreciated, is the impact of the methods of measurement and valuation of the products. Contrary to popular belief, New York’s offices tend to be less efficient on a net-to-gross floor area basis than their London cousins when they are measured on a common basis. To an extent, this “loss” is recouped through the inclusion of areas such as washrooms in its net internal area calculation. It is clear that care must be taken when reading benchmark value and cost metrics for each location as it is likely that some form of adjustment is needed to ensure they are like-for-like.
All this is reflected in headline construction costs that show London to compare well. That said, both cities pay high prices for new buildings on a global scale, and both must continue to address some fundamental issues to retain and improve competitiveness.
These issues are beyond the scope of this article, but include how our industries can design, procure and manufacture/construct buildings efficiently, collaboratively and with less risk. Peculiarities in markets will shape how they do this, and there should be things that we can learn from each other – but producing buildings of the right quality (not too high nor too low), in the best possible time for the best price will always be the objective – however the market rules and whatever the market rules.
This article was written by Steve Watts, Michael Coplowe and Rachel Coleman of Alinea and Andrew Smith of Dharan Consulting


No comments yet