


New work output expanded in the latest quarter to a year-on-year figure of 4%. But despite better numbers, uncertainty lingers – yet optimism is equally in evidence. Michael Hubbard of Aecom reports
01 / Summary
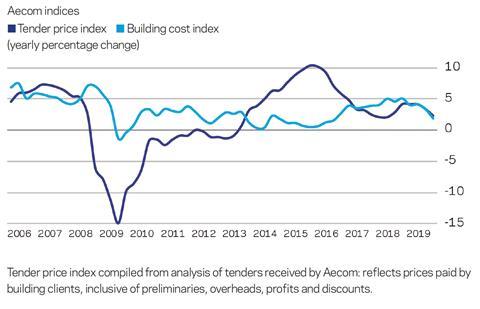
Tender price index ▲
Tender prices increased by 2.3% over the year at Q4 2019. Although still positive on a yearly basis, it is the fourth consecutive quarter where the rate of change slowed.
Building cost index ▲
A composite measure of building input costs recorded a 3.4% yearly rate of change in Q4 2019. Materials prices mostly fell from Q3 to Q4 but labour rates stayed elevated in the main.
Consumer prices index ▲
The annual rate of change slipped to 1.3% in December 2019 from 1.5% a month before. This is significantly below its target rate of 2% but will help real-terms wage increases.
02 / Output and new orders
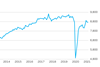
UK construction output
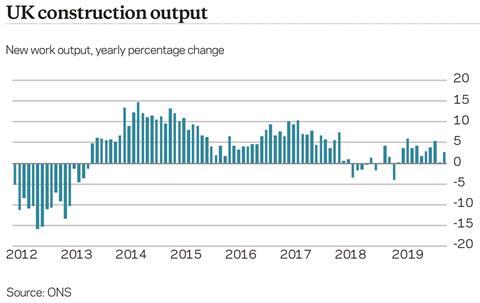
Construction new work output grew 4% year on year in Q3. Revisions to the data set helped to propel this rate of expansion, after what was looking like an uneven year of industry growth. At 1.9%, the month-on-month movement for the all-work measure was welcome, reversing the preceding monthly data point when output dipped by 2.2%. Further reassuring news was evident using the same metrics, but excluding housing. The housing sector has provided a good degree of cover in recent years when other sectors were experiencing weaker periods of activity. Stripping out housing provides an indication of the strength of activity elsewhere.
Curiously, sentiment surveys for construction by and large indicate prevailing weakness across the industry. A large degree of uncertainty accompanies the survey narratives. Looking at the output data, is the subdued sentiment overdone? Headline construction output is expanding, albeit at a slower rate than in recent bumper years. However, most sectors recording yearly increases indicates that there is workload momentum still, even if external factors conspire to provide a backdrop of uncertainty.
New orders
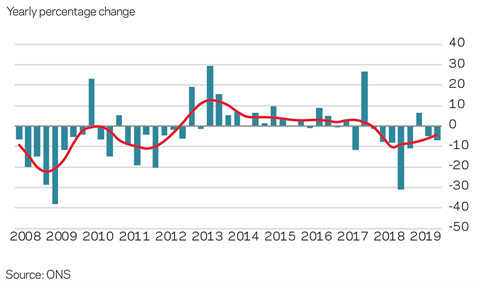
Total orders for new work showed no real improvement year on year in Q3. Similarly, the quarter-on-quarter change, although just positive at 0.3%, was hardly a stellar uptick. Sector breakdown shows that it was housing and infrastructure that wrote the positive story for new orders. The remaining sectors all saw notable declines year on year. The good news is that housing and infrastructure are two of the largest construction sub-sectors, meaning future activity emerging from the new orders will have a bearing on overall industry workload and associated market dynamics.
Expectations are high that a sustained uptick in new orders will follow in 2020. Now that the path for the UK’s exit from the EU is at least partly visible, will projects be unlocked? The story is slightly more nuanced, as it implies there is no differentiation between project sizes. The Brexit brake appears to have hit larger projects more, perhaps because they carry bigger commercial and operational risks. Tactical approaches have been used in pre-contract stages, though. Mitigation has been introduced by proceeding on a design stage by design stage basis, which allows reviews against the latest economic and political picture at the end of each stage.
03 / Activity indicators
Business sentiment
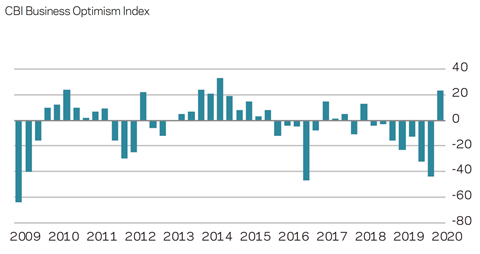
Business sentiment took another step down in the final quarter of 2019, according to the CBI’s optimism index of manufacturing firms. But it recovered to record +23 in the early part of 2020, its highest level since 2014. The reading of -44 is the third-lowest data point in the past 11 years. The lower readings followed the EU referendum (-47) in 2016 and the first quarter of 2009 (-64). The reading in 2009 was the nadir of this survey during the global financial crisis. Nonetheless, this index over-reached reality in 2016, bouncing back strongly as the economy retained a good degree of momentum. This propelled the construction sector to an extended period of good activity and output through to 2019.
Is the story different this time? Or will 2020 see a return to solid industry growth? The construction sector on its own is arguably performing better than many UK-wide economy metrics. Construction is mostly a domestic-facing market though, whereas manufacturing and services export as well as serving domestic markets, and this may account for the difference.
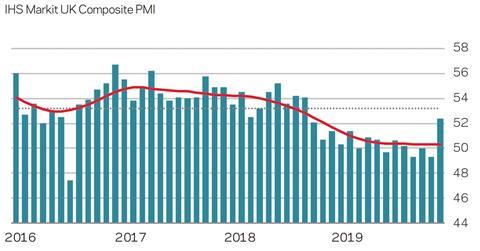
In December, Markit’s composite PMI sank to a level similar to that posted shortly after the EU referendum. The difference between the data points is the direction of travel leading up to each position. A steep drop in 2016 was followed by a rebound immediately afterwards. This is a composite index, so is broad in its make-up. But the lead-up to the latest position has seen a prolonged slide from highs in 2017 and mirrors quite closely the way that the rate of construction output has travelled during the same period. This said, the latest reading recorded an uptick, in large part due to expectations of greater certainty after the general election.
GDP data covering the third quarter extended the year-on-year growth rate seen for much of 2019. Rather benign in other words. Many other business confidence surveys continue to describe the uncertainty clouding the UK as a brake on activity – and how investment has suffered as a result. Bouts of stockpiling in 2019 helped to propel UK economic activity. However the associated unwinding of inventories subdued GDP measures subsequently.
04 / Building costs
Sterling moved out of its range-bound course of the past three years after the general election. The optimism was short-lived though, and sterling retreated. This suggests that markets are withholding judgment on the UK’s future until definitive aspects of a UK/EU trade deal become clear. In the meantime, and in the absence of significantly positive or adverse news, sterling is likely to tread a similar range-bound path over 2020.
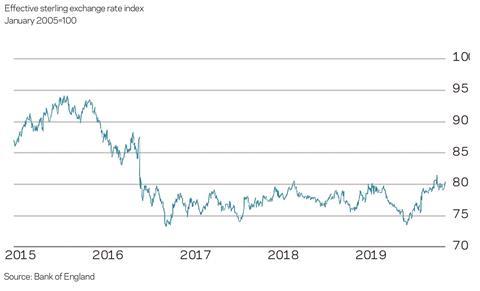
What are the implications for construction through 2020? Inflationary pressures will remain as a result of sterling’s value against the US dollar and euro. This is despite consumer price inflation falling back well below its 2% target over Q4 2019. Is sterling’s current value considered the “new normal” given its prolonged duration at this level? If it is anchored to this range, it is likely that the construction supply chain will experience ongoing pressure on its input costs. Furthermore, there will be non-tariff barriers coming into play as a result of the Brexit negotiations, adding to the input cost equation.
Inputs
Aecom’s composite index for building costs – comprised of materials and labour inputs – rose by 3.4% over the year at Q4 2019. The Q4 number eased marginally, but not significantly enough to change the prevailing cost and price dynamics that the supply chain continues to grapple with. There was an average fall of -0.7% across all inputs between Q3 and Q4. The largest falls were recorded in metal decking (-6%), concrete reinforcement (-4%) and steel doors and windows (-4%). Only one item, precast concrete (0.4%), showed an increase during the quarter.
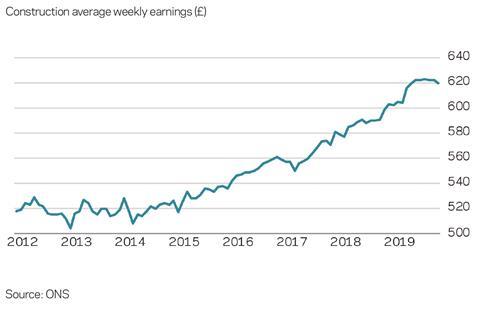
According to ONS statistics published in January, UK average weekly earnings (AWE) grew by 3.4% excluding bonuses in the three months to November compared with the year before. For construction workers AWE grew by 4.6% for the same period. Earnings growth continued to soften a little towards the end of last year, but 2020 could start with solid real pay growth as demand for workers holds up, inflation eases and the increases to the national living wage and minimum wage kick in.
05 / Tender prices
Resources
An aggregate measure of wage rates for site labour shows they increased by just under 2% annually in Q4 2019. Tellingly, UK construction supply chain capacity measures tightened somewhat towards the end of 2019 despite a slower rate of wage inflation. The part-reversal of available capacity over a short period of time in Q3 and Q4 emphasises and highlights the sector’s prevailing capacity tightness. If there is a much-vaunted Brexit bounce, spare labour market capacity is likely to quickly vanish. A commensurate increase in wage rates will quickly follow, with commercial tensions increasing once more for supply chain firms. The speed of this change will be a significant management and project delivery challenge.
Further complications arise when cyclical demand dynamics come in to play. Although there is a general theme across the UK and Ireland regarding skills and capacity, localised demand spikes can lead to an acute local market reaction to trade rates. Capacity, skills, pricing and timing can cut across each other at times, often influencing the number of replies to market enquiries and corresponding prices. Given this interplay of factors, knowledge of regional dynamics is critically important now to plot a way through a successful procurement exercise.
TPI forecast
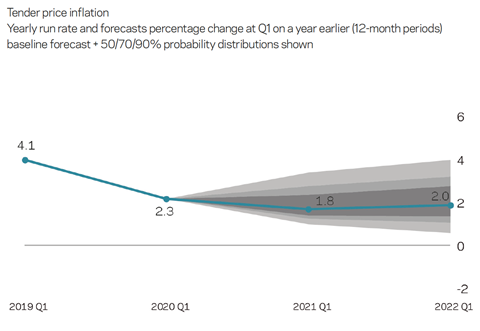
Tender prices increased by 2.3% over the year at Q4 2019. Keener pricing is evident, although it is not consistent across all trade packages nor all of the UK. Early works trades can see particularly lean pricing, commensurate with slackness in preliminary works activity. Because rates of price change are lower, albeit marginally, than rates of change for input costs, commercial pressure for construction firms continues. Balance sheet strength should help ride out the period; however these dynamics are not sustainable over the medium and longer-term. Begbies Traynor’s latest Red Flag alert survey underlines the commercial tightrope that many construction supply chain firms are walking.
Aecom’s baseline forecasts for tender price inflation are 1.8% from Q1 2020 to Q1 2021, and then 2.0% from Q1 2021 to Q1 2022. Upside skew accompanying the forecasts is more prominent across the forecast periods now. Assumptions underpinning the forecasts include output reverting to somewhere near a long-run average without excessive volatility; input costs remain elevated and higher than tender price inflation; and improved certainty through 2020 in respect of the UK/EU negotiations unlocks some currently held projects.


No comments yet