Our quarterly analysis of the main construction cost indices shows material and labour price continuing to rise, but global economic uncertainty may affect the numbers in future. David Holmes of Aecom reports
01 / Key changes
| % | Direction | |
|---|---|---|
| Building cost index | +4.9 | ▲ |
| Mechanical cost index | +4.4 | ▲ |
| Electrical cost index | +2.7 | ▲ |
| Consumer prices index | +2.4 | ▶ |
(Q2 2018 figures are provisional)
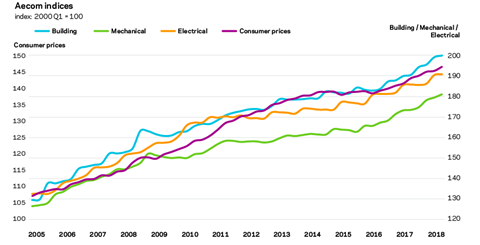
Building cost index
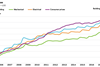
A composite measure of building costs increased by 4.9% over the previous 12 months. Materials costs remained a significant driver of cost inflation to the overall index, likely driven by the fall in sterling against the euro and the dollar, which introduced inflationary pressures from the subsequent higher cost of imported materials and components, particularly with dollar-priced commodities. Labour costs also continued to rise steadily over the second quarter as contractors report difficulty in recruiting skilled labour, particularly carpenters and bricklayers.
Mechanical cost index
Aecom’s mechanical cost index shows the rate of annual change slowed to 4.4% in the second quarter of 2018. Labour and materials maintained steady increases, but some inflationary pressures appear to be easing.
Electrical cost index
Aecom’s electrical cost index increased by 2.7% over the year. This marks an increase in the rate of change, likely stemming from a significant pick-up in global metals commodity prices experienced through the first half of 2018.
Consumer prices index
Consumer price inflation maintained its recent levels in the second quarter of 2018. Consumer price inflation is expected to stay elevated through 2018 as higher import costs keep the rate above its target of 2%.
The chart below shows Aecom’s index series since 2005, reflecting cost movements in different construction sectors and consumer prices.
02 / Price adjustment formulae for construction contracts
Price adjustment formulae indices, compiled by the Building Cost Information Service, are designed for the calculation of increased costs on fluctuating or variation of price contracts. They provide guidance on cost changes in various trades and industry sectors – those including labour, plant and materials – and on differential movement of work sections in Spon’s price books. The 60 building work categories recorded an average rise of 4.1% on a yearly basis. The six highest rises were recorded in:
Price adjustment formulae
| June 2017 – June 2018 | % change |
|---|---|
| Metal: decking | 9.0 |
| Concrete: reinforcement | 8.6 |
| Cladding and covering: steel | 8.1 |
| Piling: steel | 8.1 |
| Windows and doors: steel | 7.6 |
| Cladding and covering: copper | 7.0 |
The other changes were as follows (only one category recorded a decline and one no change):
| June 2017 – June 2018 | % change |
|---|---|
| Cladding and covering: lead | -0.6 |
| Doors and windows: aluminium | 0.5 |
| Cladding and covering: aluminium | 0.5 |
| Finishes: latex flooring | 1.3 |
| Glazing | 1.5 |
| Finishes: flexible coverings | 1.7 |
| Ironmongery | 1.8 |
Materials
03 / summary
- Consumer price inflation increased by 2.4% in June 2018 compared with the same month a year earlier ▲
- Manufacturing input prices increased 10.3% in the year to June the largest contribution made by petroleum products reflecting five months of consecutive increases ▲
- Factory gate prices (output prices) rose 3.3% in the year to June 2018 ▲
- Commodity prices maintained an upwards trajectory in the second quarter of 2018, though the rate of change slowed and fell for aluminium ▲
- Construction materials prices continued to increase on an annual basis in the second quarter of 2018, although demand in many types have yet to reach pre-recession levels ▲
04 / Key Indicators
Construction industry
The BEIS all-work materials price index increased by 6% in the 12 months to June 2018. Housing-related materials increased by 5.2% over the same period. Non-housing prices rose by 6.1% annually. All M&E categories continue to post significant yearly increases.
| Construction materials | % change June 2017 – June 2018* | |
|---|---|---|
| New housing | 5.2 | ▲ |
| Non-housing new work | 6.1 | ▲ |
| Repair and maintenance | 6.1 | ▲ |
| Mechanical services materials | % change June 2017 – June 2018* | |
|---|---|---|
| Housing only | 8.8 | ▲ |
| Non-housing | 6.0 | ▲ |
| Electrical services materials | 4.5 | ▲ |
| Materials showing largest cost movement | % change June 2017 – June 2018* | |
|---|---|---|
| Imported plywood | +23.3 | |
| Concrete reinforcing bars (steel) | +16.1 | |
| Fabricated structural steel | +11.0 | |
| Imported sawn or planed wood | +10.4 | |
| Builders woodwork | +6.9 | |
| Insulating materials | +5.8 | |
| Pipes and fittings (rigid) | +5.0 | |
| Paint (aqueous) | +4.8 | |
| Pipes and fittings (flexible) | +4.2 | |
| Data sources: BEIS *provisional |
UK economy
| Consumer prices | % change June 2017 – June 2018 | |
|---|---|---|
| Consumer Prices Index (CPI) | 2.4 | ▶ |
| Consumer Prices Index (CPIH) | 2.3 | ▶ |
Consumer price inflation including owner occupiers’ housing costs was 2.3% in the 12 months to June 2018. This marks a further slowing in the rate of change, reflecting the reducing effect of the past fall in sterling and all-round competitive pressures. Energy, utility and fuel prices have all been increasing recently.
| Industry input costs | % change June 2017 – June 2018 | |
|---|---|---|
| Materials and fuels purchased by manufacturing industry | 10.3 | ▲ |
| Materials and fuels purchased by manufacturing industry excluding food, beverages, tobacco and petroleum industries | 5.4 | ▲ |
Input costs increased by 10.3% on a yearly basis up to June 2018. This reflects a pick up in the rate of change after a slower period of input cost increases over the first quarter of 2018. The largest upward contributions came from refined petroleum products oil and metals, both of which tend to be imported and are therefore subject to the changes sterling exchange rates. Construction materials had quite significant increases.
| Industry output prices | % change June 2017 – June 2018 | |
|---|---|---|
| Source: ONS | ||
| Output prices of manufactured products | 3.1 | ▲ |
| Output prices of manufactured products excluding food, beverages, tobacco and petroleum | 2.4 | ▲ |
Factory gate prices increased by 3.1% on a yearly basis to June. The largest upward contribution from non-food items was from petroleum products. This 12-month rate of change has been positive since July 2016 and is below the corresponding trend for input costs.
Construction remains little changed on a year ago with caution around the short-term outlook. The level of activity bounced back from the effects of adverse weather in the first quarter, but has not been fully made up partly owing to continuing capacity constraints. Housebuilding remains the strongest part of the sector.
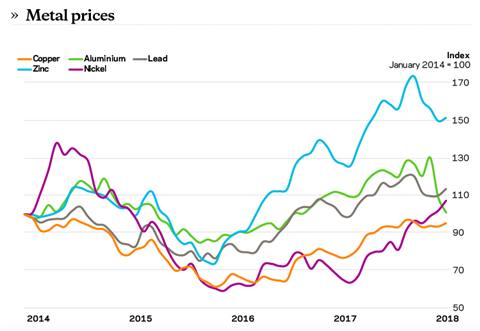
| % change June 2017 – June 2018 | ||
|---|---|---|
| Aluminium | -7.7 | ▲ |
| Copper | 22.0 | ▲ |
| Lead | 14.5 | ▲ |
| Zinc | 21.2 | ▲ |
| Nickel | 69.1 | ▲ |
Source: LME
Aluminium prices have fallen with the uncertainty surrounding the market and trade sanctions and increased inventory levels, but the price remains volatile. Other commodities continue their upward trend although the pace of change slowed as ongoing uncertainty around global economic activity.
Further movements in price trends will play out through 2018, as the impact of the tariffs and retaliatory measures begin to influence overall levels of global economic activity, along with any supply responses around domestic metals production and possible results of trade sanctions.
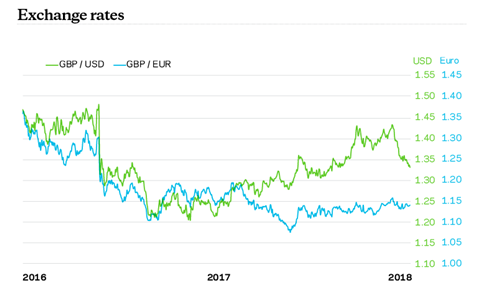
| June 2017 average | June 2018 average | % change | |
|---|---|---|---|
| GBP / EUR | 1.1403 | 1.379 | -0.2 |
| GBP / USD | 1.2813 | 1.3288 | +3.7 |
Sterling lost significant ground against the US dollar recently. Stronger economic growth and a higher probability of bank rate increases in the US make its currency a preferable FX holding to sterling. Persistent uncertainty remains for the UK, as the chance of a no-deal Brexit appears to be growing. Against the euro, sterling has made little or no progress in moving away from its prevailing level after the European Central Bank said it would keep interest rates at zero until “at least next summer”.
Labour
05 / Labour market statistics
- Average weekly earnings (total pay including bonuses) in construction were flat at £612 in June 2018, from £611 in April. Annually, total earnings increased 5% to June on a single-month basis. Regular pay (excluding bonuses and arrears) rose to £594 per week in June, from £591 a month earlier.
- Construction industry regular pay rates maintained its lead over earnings for the UK economy, with an average weekly earnings of £610 compared with £516 for the three months up to June n Real average weekly earnings for the whole economy show a very slight increase of 0.1% for the three-month average to June 2018 versus the same period in 2017.
- Builders and civil engineering operatives working under the CIJC agreement receive a 3.2% increase in wages from 25 June 2018, the first part of a two-year agreement, with a further 2.9% from 24 June 2019.
- Builders under the BATJIC agreement will receive a 3.1% increase in wages from 25 June 2018.
Aecom’s cost indices track movements in the input costs of construction work in various sectors, incorporating national wage agreements and changes in materials prices as measured by government index series.
They are intended to provide an underlying indication of price changes and differential movements in the various work sectors but do not reflect changes in market conditions affecting profit and overheads provisions, site wage rates, bonuses or materials’ price discounts/premiums. Market conditions and commentary are outlined in Aecom’s quarterly market forecast (last published August 2018).


No comments yet