


In the latest of our whole-life cost comparison articles, David Weight of Currie & Brown examines the crucial financial considerations when deciding the height of an office block
Introduction
There are a number of reasons why developers and owner-occupiers would wish to consider developing taller buildings. These include greater prestige and image, as well as the advantage of this enhanced prestige promoting the surrounding area and encouraging further development.
However, the most common reason for developing taller buildings is better land use. With increasingly limited land, it makes sense to build taller to maintain growth while limiting urban sprawl. But the rental sector’s equivalent of a building’s sales value, the capitalised gross development value, may not be a true reflection of the building’s whole-life value because some of the longer-term benefits and liabilities are not always fully appreciated by clients or tenants. Here we compare the whole-life costs of developing four-storey and eight-storey buildings and see what effect the change has on developer profit margins.
.jpg)
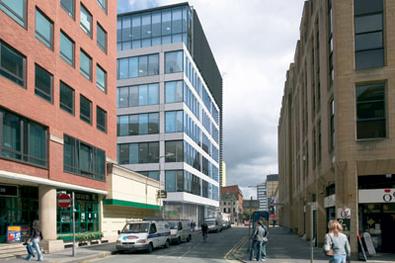
Marlow International, a four-storey office building in Buckinghamshire, was developed by Akeler and designed by architect Aukett
Live Options: The whole-life costing computer model
The whole life costings presented here are based upon Currie & Brown’s Live Options software, which is an integrated suite of geometric, engineering and energy calculation programs. Whether the development is an office, school, hospital or warehouse, the process starts in the same way, by using a basic but faculty-specific design template. This template is modified to incorporate, for example, changes in the size, shape, and operational performance.
The program integrates fabric and building services components and can show how costs change when a building element is changed, for example increasing the proportion of glazing in the facade. It does this by providing a detailed breakdown of changes and shows the capital costs of physical items and the effect these have on building performance.
Any changes to heating and cooling loads will be quantified in terms of the effect this has on, say, chillers and the electrical supply loads.
Changes to the energy profile of the facility are also calculated. The program uses this data to assess the cost effectiveness and overall viability of alternative solutions when considered against the facility’s projected economic life.
The model also takes account of repair and maintenance costs. This includes regular inspections and planned and unplanned maintenance and replacement costs for individual building components. These costs are automatically cash-flowed, discounted and summarised and net present costs are shown against each component, which assists in making choices and in value-engineering.
Our base building
Shown opposite are the typical capital, energy and repair and maintenance costs for a typical deep-plan, four-storey, air-conditioned office building with a gross floor area of 12,000 m2.
Since land use is such an important economic driver for this scenario, this time we have included a view on the development profitability below, based loosely on a location in Sussex. The building has gross-to-net floor area of 80%, which equates to 9600 m2: at 12 m2 per person that adds up to 800 occupants.
The graph below assumes a rental value of £22/ft2 a year and 6% net yield.
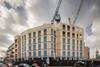
Architect Sheppard Robson designed this eight-storey office block, Cobbetts House under construction in Moseley Street, Manchester
Scenario one: Increasing the building from four storeys to eight storeys - capital costs
Here, we compare a four-storey building with an eight-storey alternative of similar gross floor area. For this scenario, changes were needed for just four inputs as follows:
- Switch from four to eight storeys
- Increase in construction period (Live Options advises on this but does not calculate it)
- Increase in preliminaries by 3% to allow for increased need and use of cranes, hoists and the like, and for longer construction period
- As the vertical circulation area has increased, the net area has reduced because tall buildings have proportionately greater vertical circulation and plant areas. Live Options monitors the sum of this and advises that this has increased by about 500 m2. If the net area per member of staff is unchanged (set at 12 m2 per person), the occupancy therefore reduces by this amount. This reduces the number of people by 42 and the associated costs.
Changes to the capital costs
The capital cost changes in the graph (see attatched graph) are explained as follows:
- Substructure: The dominant issue here is a 50% saving on the area and cost of the ground slab (light blue), ground preparation (red), and girth of foundation walls (blue). There will be almost a 50% reduction in the number of piles, caps and associated ground beams (green), but the friction piles are assumed to be longer because of the extra weight. (The model can calculate the effect of increased friction with depth). Yellow represents an extra lift pit.
- Structure: Red indicates the increase in frame costs. This is mainly for bigger columns, but includes extra wind-bracing and perimeter beams. Green denotes the extra cost of upper floors, and yellow indicates the cost of the stair structure and associated balustrading. (Unlike the BCIS system, Live Options groups the last two together since they often arrive on site as a prefabricated unit.) The number of shafts is reduced, as it is geared to the distance for means of escape, but the number of flights per shaft equals the number of levels minus one.
- Envelope: The reduced roof area is the big saving (red). Light blue denotes a small saving in the number of external doors as a result of the number of stair shafts. The girth of envelope increases. To understand this, picture two lego bricks, abutted side by side. Take one and put it on top of the other. The sides which were abutted have now become exposed. This increases external walls (blue), windows (yellow) and some associated brise soleil (mauve).
- Internal division: Red indicates the extra load-bearing walls to stair shaft and lift shafts. The model makes the default assumption that the sum of perimeter of rooms is unchanged. As one side of the stair and lift shaft walls border other spaces, then it assumes that other non-load-bearing wall types (green), are reduced as the load-bearing walls increase. Yellow denotes a small saving on toilet and shower cubicles, and associated duct paneling caused by fewer people.
- Finishes adjust according to the areas of structure to which they apply. Red is wall finishes which includes plaster base or drylining needed to the stair and lift shaft walls. Yellow is finishes to stairs. Floor finishes (green) and ceilings (blue) to other areas are reduced by more lift shaft voids, and replaced by the stairs. Mauve denotes a small saving on vanity units.
- Mechanical: Green denotes the wet riser in stair shafts. Blue (heating) and yellow (cooling) indicate increased design load capacities for each (see commentary on energy changes, opposite). These extras were mitigated by savings created by having less net and fewer people. The savings denoted by red are for fewer sanitary fittings and associated plumbing and disposal installation caused by fewer people, and less drainage under the building, because we have half the number of downpipes coming down to ground level. There are also cost changes in mechanical ventilation that do not show up on the graph as they all but cancel each other out: the extra is for stair shaft pressurisation (smoke extract) but also extra for lift motor rooms. However, these costs are mitigated by a reduction for deep plan ventilation in response to extra external wall. (Less area is more than 6 m from perimeter).
- Electrical: The supply load and cost increases in response to the increased number of lifts and more powerful motors (red). The increase in load has been mitigated by reduced heating and cooling loads, and use of electrical appliances as a result of reduced occupancy. Electrical infrastructure is reduced with less occupancy and workstations (green). Lighting (blue) is reduced, as the illumination is generally less in non-net areas. External security is reduced according to the building’s reduced girth and fewer cameras (light blue).
- Transport: The suggested number of lifts was increased from three to four (hence the extra lift pit and shafts - see above). Also the speed, motor size and cost for each lift has increased.
- Preliminaries have been increased (red), but the percentage for overheads and profit (light blue) is assumed to be unchanged.
The extra cost of going from four to eight storeys allowing for increases of 3% design and price risk and 5% construction contingency and a reduction in net-gross ratio and associated occupancy is £780,100.
This extra cost is less than cost statistics might lead one to believe. However, statistics often do not always reflect “like for like”. As areas with high property and land values are more likely to have tall buildings, the construction standards will be higher as well, whereas our study assumes that the construction quality is unchanged.
Scenario one: Increasing the building from four storeys to eight storeys - energy costs
Before reducing the net and occupancy level, the extra energy cost of going from four to eight storeys was calculated at £2430 pa. However, reducing the net and occupancy level showed a saving of £2820 pa, resulting in a difference, and overall saving, of £390 pa. This is because in most modern buildings, most energy consumption is driven by occupancy (breathing, metabolic gains, use of computers, printers, hot water usage, use of lifts, etc).
To explain the changes to energy consumption:
- Fabric losses: Floor (red) and roof (mauve) losses reduce, while wall (green) and window (blue) losses increase.
- Ventilation losses: There is an increase in unwanted air infiltration through the envelope at higher levels because of higher wind speeds (blue). However, air supply is reduced (red) because of reduced occupancy.
- Winter gains: Mainly solar gains for more windows (red). As lights are used a bit less, the slight contribution to heat gains is reduced, so this shows as an extra (yellow). Heat contributions from occupants are reduced in terms of their metabolic gain (blue).
- Cooling: Yellow is the reduced burden of lights, as these are on less, and the burden of occupants’ metabolic gains (light blue) and power (mauve) are also reduced. However, these savings are counterbalanced by the solar gain from the increased window area (green).
- Fans: Main AHUs are linked to the increased cooling load (red). Sundry other ventilation (such as for toilets) is linked to occupancy, so reduced slightly.
- Hot water usage reduces with occupancy.
- Lifts rise in number, power, and usage (red).
- Power: Red is pumps. As the building is now more compact, the pump head reduces, and heating and cooling loads further reduce the pump load. Small power use by occupants reduces (green). Blue is saving on parasitic loads such as some water heaters, and supporting heat recovery.
- Lighting: The illumination level in net areas is higher than in other areas, so reducing the net-gross reduces light output (red). Also, task lighting (green) reduces as this is geared to occupancy, unlike other general lighting. The period of usage of lights is assumed to reduce because of a higher daylight factor, as the envelope-floor and window-floor ratios increase.
Scenario one: Increasing the building from four storeys to eight storeys - repair and maintenance costs
Finally, to illustrate the financial incentive in exploiting land, let’s consider doubling both the gross floor area and the height, so that the total footprint is unchanged compared with our base building.
To do this, four inputs are required from the original base scenario:
- Doubling the gross floor area
- Increasing the construction period
- Increasing preliminaries
- After checking the tally of vertical circulation, reducing the net-gross ratio.
The changes, in cost/m2 terms, are similar to those illustrated previously, except that, unlike the first change scenario, the building’s floorplate at each level is not reduced, and the wall-floor and window-floor ratio is unchanged this time. This scenario may well be unrealistically large in scale, but for the sake of simplicity, is assumed to be viable, and assumes the same net area and therefore value.
Changes to residual profit
In this example, the net profit has increased dramatically, as the land cost is less significant, although the profit margin has hardly changed. However, the rate of return on capital employed is slightly less.
At the introduction, effective land use was cited as a key driver in deciding how tall buildings need to be. But there are social concerns that are not addressed by conventional economic criteria, even when whole-life costs are considered over 30 years.
So what does this mean? When we look at infrastructure projects such as water pipelines or sea defences, longer periods are considered, and spare capacity is often built in - or taking another example, road construction often allows for extra lanes to be added at a later date. So perhaps the structural elements of new buildings, especially public buildings, should be designed so they can be extended upwards in the future.
Downloads
Profit development appraisal
Other, Size 0 kbChanges in capital costs
Other, Size 0 kbChanges in energy costs
Other, Size 0 kbScenario One: Profit development appraisal
Other, Size 0 kbScenario Two: Profit development appraisal
Other, Size 0 kb


No comments yet