


BSJ has obtained a draft report of a DTI trial of photovoltaic systems in UK dwellings: the first study of its kind. The trial, which covered 28 schemes, will be used to inform the building and energy industries about the technology’s suitability for homes. So how well did it perform?
How did the systems perform in practice?
The field trial, carried out for the DTI, looked at the design, construction, commissioning and performance of PV systems. Perhaps the most surprising result to come out of it is that many of the systems tested are operating in line with expectation, providing annual yields of 800 kWh/kWp or more.
How much electricity does an average domestic system produce in a year - and how did that compare with predicted yields?
The annual yield varies according to the orientation of the array and the weather it experiences. Most schemes used PVSYST, RETScreen or proprietary software to predict a system’s output and forecasted annual yields were at 740-840 kWh/kWp. Of the 17 sites tested, five gave measured values close to those predicted, two gave slightly higher values and four gave lower yields (six had incomplete data).
PVs are notoriously inefficient, so how well did they perform?
System efficiencies are low. They ranged from about 4.5% for thin-film silicon tiles to around 10.5% for single-crystal silicon modules.
Is inefficiency the only drawback?
Many systems in the trial showed considerable internal losses, in some circumstances equivalent to years of lost output over the life of the system. A significant number of systems had performance ratio (PR) values of 0.65-0.7 (the PR compares a real system with an ideal (loss-free) system). Yet, the report states, the aim should be to have a system with a PR of 0.75-0.8 or above. This is a significant discrepancy because over a system’s 25-year life, a cut in PR value from 0.75 to 0.65 will result in a loss equivalent to over three years of output.
What caused the internal losses?
They were mainly attributable to problems with system inverters and partial shading of the collectors. The most severe system losses were caused by lengthy periods when inverters were not operational. Of the 274 systems considered, 22 had periods of several months when the inverter was not active. Common causes of inverter failure include an inbuilt fault in the inverter; a voltage spike in the grid electrical supply causing the inverter to trip; deliberate shutdown of the inverter to allow work on the electrical system and a failure to restart; and consistently high grid voltages above the maximum voltage of the protection settings that prevent inverter operation. Four sites were found to suffer from this problem on the trial.
The biggest problem with inverters was that users were unaware that the unit was not operational. Most were in the loft space, so the fault warnings could not be observed, leading to long delays between the problem occurring and its resolution.
Any other performance problems?
Shading by trees or from the building itself (by chimney, satellite dish or changes in roof height) were potential causes of ‘significant losses’. Shading often causes higher than expected losses because of the connection arrangement of most PV arrays. The report says many of the sites’ teams failed to alter their designs to minimise these losses. They recommend that:
- Designers should take account of all sources of shading, particularly those related to shading by other parts of the building and should locate the array in a shade-free location even if this means reducing the size of the array.
- Where shading cannot be avoided, the interconnection of the PV modules should be configured to minimise the effect of the shading.
- The system user must be made aware of the need to keep trees and vegetation in check through the life of the system.
The solar fraction is the output of the system as a percentage of overall demand over a year. Its average value is 51%, although this depends on the lifestyle of the occupants. The report’s authors say that even for an average system size of 1.6 kWp (see figure 1), “the output from the PVs can contribute a significant proportion of the building requirements over a year”.
Was it easy to connect to the grid?
No, in a word. The authors say the whole process needs to be improved in consultation with the industry. Difficulties include identifying a suitable electricity buyer and securing renewable obligation certificates (ROCs). They say the process is poorly understood both technically and financially and there is “considerable scope for streamlining the process of connection”. One suggestion is for suppliers to offer a uniform tariff for buying green electricity linked to the supplier claiming the ROCs.
How much does it cost to install?
At £5.11/Wp, new-build, frame-mounted systems were the cheapest overall; new-build, tile-integrated systems were the most costly at £8.28/Wp, because the tiles are expensive and the high number of wiring connections for the same size of system takes longer to install (see figure 2).
What is the cost of electricity generated by PVs?
Using the figures for 25 sites based on a system lifetime of 25 years, costs varied from 20.9p/kWh to 184.7p/kWh. The average cost of electricity was 47.5p/kWh. Taking out the two most expensive sites, which the report says were under-performing, gives a more realistic average of 39.1p/kWh. The report’s authors acknowledge this is “well above current electricity prices” and optimistically forecast that with PV system prices falling and energy costs soaring “convergence could now come soon”.
What were the main lessons learnt?
Poor communication between the PV industry and the construction industry in making different trades aware of their different requirements was key on almost all projects. Efficient and effective contractual arrangements were also found to be important, particularly when PV installers need to meet the requirements for approved contractor status.
How easy were the systems to maintain?
PV modules generally require little maintenance, but the trial demonstrated that inverters and displays should be easily accessible to avoid any follow-on problems in maintaining the system. Also, documentation for customers and customer services must improve.
How well did homeowners accept the PVS?
User acceptance was high but there was a lack of understanding of how they work and of the fact that behavioural changes are necessary to maximise system return.
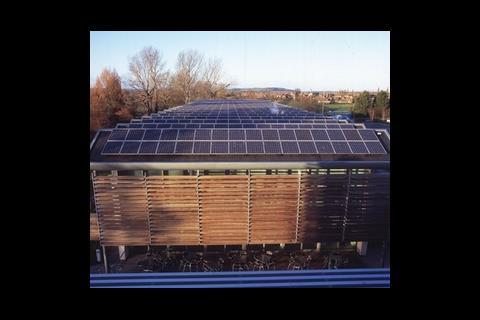
Case study: Corncroft, Nottingham

One of the 28 projects studied by the research team is Corncroft in Nottingham; a social housing scheme of 22 new-build bungalows for elderly and disabled occupants. The buildings are designed to be low energy, with features such as low ‘e’ glass, very high insulation and PV modules.
The development uses PV laminates integrated into the roof with the PV installers’ bespoke roof-integrated mounting system. Of the 22 systems, 20 produce 1.53 kWp each and two produce 1.7 kWp each. Array tilt is 60° and orientation is SSW.
Installation and commissioning
During the building of each bungalow, a designated roof space was left without tiles for the PV integration. The pre-fabricated mounting section was then secured on the roof space. Once the mounting system had been fixed to the roof, the first PV laminates were attached. These were then wired up and tested for continuity by an electrical engineer. During installation one PV module broke, but aside than this no other technical problems occurred on site.
Initial confusion over whom to contact about permission to connect the PV systems to the grid caused some delays. But once local district network operator East Midlands Electricity Distribution was given all the relevant information, permission was granted promptly. Initial discussions with electricity suppliers about an export tariff for the surplus PV electricity turned out to be fruitless. They have now resumed discussions with electricity suppliers to seek a tariff agreement that would allow the residents to be paid for any PV electricity exported to the grid.
System costs Item Cost £ / Wp
Module installation 1.48
Electrical installation 0.45
Monitoring costs 0.67
Inverter costs 0.47
Module costs 3.41
Total costs excluding management costs 6.47
Total costs excluding management and monitoring costs 5.08
The table shows that the total cost (excluding management and monitoring) was £5.08 per Wp of capacity installed. The total average costs over a predicted 25 year life are 26.2p/kWh.
User operation, maintenance and acceptability
Faults have generally been minimal. The systems have been working effectively over the whole two-year monitoring period. Sunview displays are in operation in all the properties and allow users to see the instantaneous system output.
The tenants’ responses have overall been positive. Initial analysis shows that half the tenants said that their electricity bills were lower, associating this with the PV systems. But when questioned about how much money and CO2 the systems are saving, many were unsure about the exact amount. However, many tenants have started to run appliances during times when the PV system is likely to be operating.
Performance
The average annual yields for years one and two were 768 kWh/kWp/year and 738 kWh/kWp/year respectively. Over the two years, the average annual output was 51,695 kWh, equivalent to a CO2 offset of 11.1 tonnes per year. The predicted annual yield for a well designed system in the UK is 750-800 kWh/kWp/year. It is ecouraging that in the trial, 30% of the annual system yields were over 800 kWh/kWp/year.
Project Team
Developer: Nottingham Community Housing Association
PV Installer: PV Systems
Standard site activities: Westleigh Developments
Monitoring: ESD
Downloads
FIGURE 1: The PV’s contribution to the annual electricity demand
Other, Size 0 kbFIGURE 2: Cost for the different types of PV installations
Other, Size 0 kb
Source
Building Sustainable Design
Postscript
Two sets of good practice guidelines have been produced based on lessons learnt from this study: Part 1 covers project management and installation issues; Part 2 focuses on system performance issues. To read a full version of the report contact Ursula Garner at BRE. Email GarnerU@bre.co.uk or call 01923 664361.

No comments yet