


Tender prices in the year to Q4 kept climbing in the wake of rising building costs, as construction output rebounded in Q3 – but new orders dropped, as did business confidence. Michael Hubbard of Aecom reports
01 / Summary
Tender price index ▲
Tender prices increased by 3.5% over the year at Q4 2018. Construction price inflation is still clearly present in the supply chain and remains a source of commercial tension.
Building cost index ▲
A composite measure of building input costs recorded a 4.7% yearly rate of change in Q4 2018. Demand for construction labour and materials, combined with weaker sterling and its effect on imports, are creating commercial pressures for the supply chain.
Consumer prices index ▲
The annual rate of change eased to 2.1% in December 2018. The yearly rate of change is continuing to move towards its target, which helps real wage growth in construction and the economy more broadly.
02 / Output and new orders
UK construction output
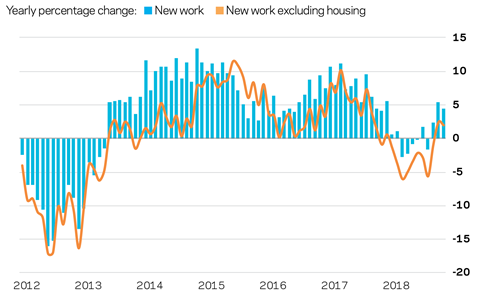
Construction all work output saw a notable rebound in Q3 2018, according to the Office for National Statistics’ (ONS) latest data release. The bump up is likely to be a combination of some additional momentum and a catch-up effect resulting from the extended period of adverse weather earlier in 2018. Private housing again, as well as infrastructure, provided the main impetus to the yearly rate of change. The public sector, private industrial and commercial sectors detracted from the overall picture – the latter two reflective of broader trends in uncertainty surrounding the UK economy. New work output also posted a respectable increase in Q4.
Although workload has been maintaining its momentum, risks to the output trend are related to how the new orders data evolved over the last 12 months. There has been discernible adjustment in the yearly rate of change in new orders, and this will bring changes in output in 2019 – both to the overall level and in terms of sector-specific changes that will flex according to broader macroeconomic themes.
New orders
New orders took a big hit in Q3 2018, the latest period for which data is available. The 31% fall over the year to Q3 2018 was striking, and comes in the wake of three consecutive falls in the yearly rate of change in preceding quarters. But taking this figure at face value could be misleading as the new orders data series is prone to fluctuation. The all new work new orders value from Q3 2017 was a significant outlier to the trend, primarily because of the infrastructure sector, and this has disproportionately increased the yearly change percentage for Q3 2018.
Only the public sector offered any positive story in the Q3 data, with all other sector classifications falling over the year. This sector accounted for just 15% of the new orders total, though, and will not materially move the data set at a national level. Regionally, the East Midlands and South-east bucked an otherwise negative trend. Although enquiries are reportedly holding up, there is some softening in the strength of this sentiment. If new orders data acts as a precursor to eventual changes in output, the risk of these consecutive negative changes and further declines in new orders is that output ultimately takes a hit later in 2019 and into 2020.
03 / Activity indicators
Business sentiment
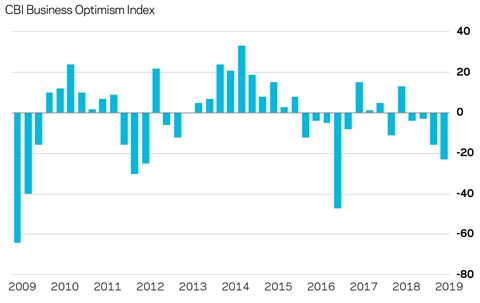
Economic and business sentiment held up until the final quarter of 2018. Now, though, many economic and business indicators are signalling a weaker picture for the economy. Heightened concerns that political and economic conditions are exacting a heavy toll on business confidence seem to be going unheeded. UK regions report along the same lines, and with no divergence between economic sectors or size of firm.
The CBI business optimism indicator in the UK fell to -16 in Q4 2018. The index dropped below its long-run average after posting this lowest reading since the EU referendum. Further messages contained within the CBI’s Industrial Trends survey indicate that manufacturing new orders declined at the fastest rate in three years, as producers reflected prevailing uncertainty; export confidence declined at a notable pace; and investment intentions deteriorated significantly.
Employment
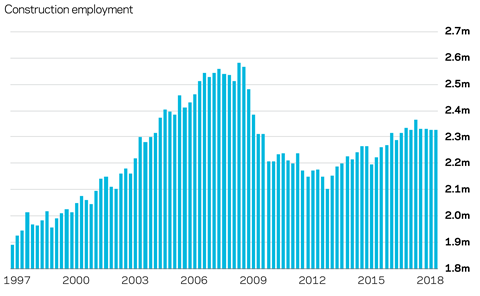
At face value, the total number of people employed in construction seems to have peaked, according to ONS data on construction employment. Resource constraints have been the source of delivery problems for the industry over recent years. They are also a central reason why tender prices increased significantly over the same period. These themes are likely to continue during 2019, with many supply chain firms continuing to experience some difficulty in recruiting site trades to build out existing workload to completion.
Sector dynamics will introduce further operational considerations, as will the balance between early works trades and later site trades that reflects the movement through any build programme. However, most industry surveys suggest that employment expectations are firm for the year ahead.
04 / Tender prices
Tender prices rose by 3.5% over the year to Q4 2018. Construction price inflation maintained a steady trend through 2018, but took another leg up as output figures saw a boost in the final quarter.
Market dynamics are seeing emerging changes in risk allowances within tender submissions, on-going pressure from elevated input costs and some recruitment pressures. In combination, these trends are creating commercial pressures for the supply chain, as output prices are constrained to some extent by prevailing competition levels and client willingness to pay.
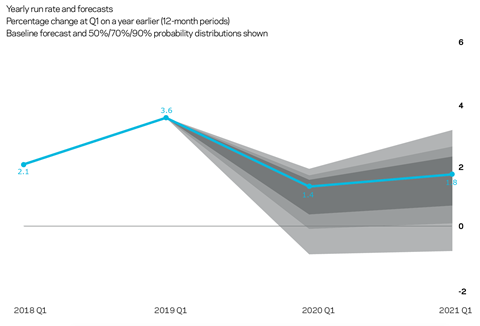
Aecom’s baseline forecasts for tender price inflation are 1.4% from Q1 2019 to Q1 2020, and 1.8% from Q1 2020 to Q1 2021. The rate of tender price inflation over the year ahead is based on output reverting to a long-run average without excessive volatility, elevated input costs as a result of weak sterling and general resource constraints. Higher expected economic and political turbulence has led to pronounced downside skew to the assessed risks accompanying the price forecasts.
05 / Building costs
Materials and labour costs
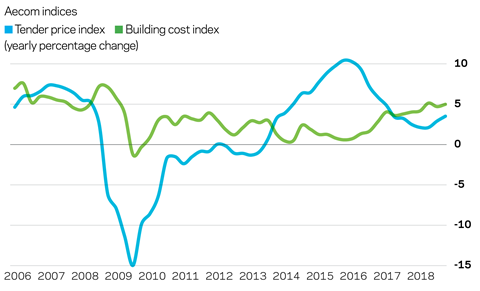
Materials and labour input costs continue to push up a composite index for building costs. At Q4 2018 the overall index increased by 4.7% compared with the same quarter in 2017. This is the highest rate of building cost inflation in Q4 of any year since 2008. Further increases on a yearly basis are expected through 2019; however, the rate of change is forecast to slow from the recent peak late last year.
Metals commodities prices have responded to a number of global themes throughout 2018: US dollar strength, slowing China economic data and global trade tensions. Some of the factors affecting the outlook for commodities have been demand-creating and some have been demand-eroding. But commodities are finding it difficult to gain any upward direction, which would indicate increased global economic activity.
Input costs will be a primary commercial pressure for the supply chain in 2019. For over 18 months now, input costs have run at a higher yearly rate of change than tender prices. This dynamic weighs heavily on commercial operations for large swathes of the supply chain, especially as prices sought for work are constrained to some extent by achievable output prices.
Availability of staff and labour
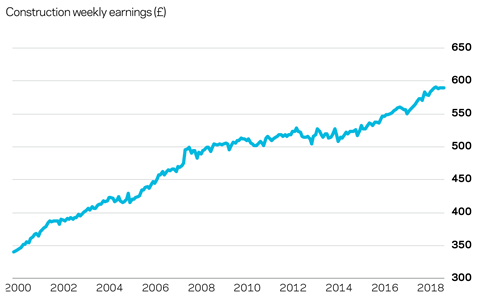
Availability of labour and staff resources remains a complication for supply chain firms. While 2018 saw some reduction in this pressure, the issue is still a significant operational risk for many firms. Consequently, wage growth for site trades through 2017 and 2018 maintained its trend of being comfortably ahead of general consumer price inflation. Signalling the on-going issues, Q4 2018 recorded a marginal increase in the trend, notably across later trade disciplines – for example, mechanical and electrical skills. Civil engineering workers saw healthy increases too. But early building trades posted much weaker yearly rates of change, which probably reflects changing market dynamics in respect of new orders and output.
Future increases in wages are expected as current industry workload creates demand for trades and skills. But the overall rate of change is likely to ebb and flow over the short term, particularly as a period of impending inclement weather hits production and the seasonal effect on wages occurs.
Exchange rates
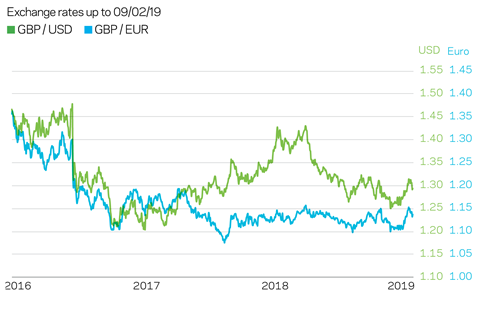
Sterling regained some ground against the US dollar during Q4 2018 but it is a weak rally overall. Against the euro, sterling has moved glacially, languishing still around the €1.11–€1.15 level. More recent news saw sterling move to the upper end of this range, mostly as a result of the markets believing that a no-deal Brexit is less likely. Brexit-related news is creating movement in sterling over short time frames, but longer-term trends have not changed materially.
Turbulence in sterling’s value might make some headlines, but its relative weakness has on-going implications for domestic inflation, and the cost of construction materials. Even if sterling rallies further, because it has been weaker for an extended period, any strengthening is unlikely to offer immediate relief to input cost pressures over the next two quarters. The foreign exchange environment will continue to work in tandem with general industry demand to support elevated rates of building cost inflation.

No comments yet