The initial market reaction to the Brexit vote was muted, with output soon recovering strongly, but the trend seems likely to have turned, just as our exit from the EU is imminent. Michael Hubbard of Aecom reports

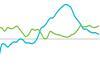
01 / Executive summary

Tender price index ▲

Tender prices increased by 1.4% over the year at Q3 2018. Inflationary pressures remain evident despite a trend to lower industry output.

Building cost index ▲

A composite measure of building input costs recorded a 4% yearly rate of change in Q3 2018. Input costs for construction labour and materials are maintaining cost pressures well above those for general economic measures.

Consumer prices index ▲

The annual rate of change eased to 2.4% in September. The yearly rate of change is the lowest for three months; it is below market expectations but still above its target of 2%.

02 / Trends and forecasts

Aecom-indices

The year 2018 so far has contained a number of different stories in respect of activity and output – falls, rises, staying flat. But an increasingly discernible trend is clear, in which activity is post-peak and there is more alignment across many of the industry metrics. 

Market reactions and market responses are different things. The market reaction to Brexit through 2016 and 2017 was initially muted. In fact, after the dust settled the industry rallied strongly, shaking off any uncertainty at the time and going on to record very strong output levels in 2017 and 2018. The present situation looks different in terms of direction, now that the market response to Brexit and the business cycle generally is emerging. The combination of these two major factors will determine the industry’s trend over the medium to long term.

The Bank of England describes the UK as transitioning to a new phase, which is based on “tightening global financial conditions, trade growth slowing, UK fiscal policy moving to a more accommodative stance and that the UK economy is adjusting to a new, and currently uncertain, relationship with the EU”. Further, against the Brexit backdrop, a steady stream of revisions to economic forecasts have arrived for the UK over Q2 and Q3 of 2018. Construction activity is directly linked to broader economic trends – where the economy goes, construction very likely follows. One indicator of confidence, private business investment, has varied since the EU referendum in 2016, but with a lower trend overall. The economy and construction will need the trumpeted “double deal dividend” on Brexit to instil confidence back into investment and decision making.

A recent British Chambers of Commerce (BCC) survey reports that almost two-thirds of firms have not carried out a Brexit risk assessment on their activities. The detail of the survey records that one-quarter of larger firms and 69% of micro-firms have not carried out a risk assessment – described by the BCC as “Brexit fatigue”. Assuming that the same trends are relevant to construction firms, this leaves much of the supply chain exposed to the winds expected to blow through the planning, logistics and movement of imported goods and components required for substantial parts of construction in the UK.

The FTSE 350 Construction and Building Materials index posted a high for the year back in May, and made a noticeable reversal during October 2018, falling almost 20%. This coincided with a broader sell-off in equities generally. It will be clear very quickly whether any rally in share prices is mirrored in both indices. However, the FTSE 350 Construction Index did record a larger fall than those of the FTSE 100 and 250 indices. This reflects the construction industry’s tendency to overshoot broader economic trends in periods of expansion, contraction or turning points in the market. Equity prices are an assessment of future earnings, and the trend is a useful indicator of future industry direction.

Momentum of workload and direction are the key factors as we move out of 2018 and into 2019. So far this year a consistent trend has not emerged, in either momentum or direction. This probably confirms the industry has passed the peak when all measures were heading in one direction. The short term retains some promise, though, and many firms claim the medium-term outlook is good too. In spite of the optimism, risks remain that will introduce operational complications as the forward pipeline becomes more variable.

The issues likely to impact businesses quickly in a post-peak environment include working capital management and tender pricing decisions. Old ways will influence the new environment, though. For example, attempts by tenderers to secure higher price levels are likely to be defeated by a single contractor with a keen bid and a higher need for work. The talk of procuring work by not discounting prices might suppose little or no change to available work. Lowest price tendering will be simply too attractive as a tendering method, as the industry has not changed enough in this area – especially in a period of slower growth. Capacity constraints are a major influencer that might negate the downside effects of higher levels of price competition in a slower market. 

Busy regional activity has increased local supply chain pressure in some locations. Inevitably, higher rates for tender pricing have followed in local trades where supply and demand imbalances introduce procurement pressures. These locations will feel busier than the aggregate UK output level implies, and probably for longer as the local hotspots insulate from any broader slowdown. 

Supply chain capacity influences will continue to be prominent cost and price drivers over the short term. Consequently, the old frames of reference – where slower activity and output led to equally noticeable falls in tender price inflation – are less certain to apply. That said, the Brexit backdrop is a unique series of events and there is no precedent for an event of such magnitude and its impacts on the UK economy and the construction sector. It has been suggested that the three-day week during part of the 1970s is the closest equivalent in trying to appraise the effects of a no-deal Brexit. Let’s hope the approaching winter is not cause for discontent. 

03 / Activity indicators

FTSE-indices

Construction’s all work annual growth rate rose to just 0.4% in Q2 2018. This was up from -0.3% in the first quarter, according to the Office for National Statistics’ latest data release. All told, the movement into positive territory at Q2 only reverses the Q1 data, leaving the first half of 2018 with a flat trend in growth for the “all work” classification.

During the summer there was talk of a Q2 rebound, after bad weather affected output in the start of the year. Strictly speaking, all work industry output did rebound in Q2 – but it is difficult to classify a 0.4% year-on-year increase as anything other than lacklustre, and this does not quite align with the rhetoric about rebound at the time. While monthly data might make headlines, it is the trends over longer time frames that reveal the story.

Change in new work output was similarly muted for Q1 and Q2 2018, recording only small differences of -0.2% and -0.5% respectively versus the same periods in 2017. A mixed picture is seen across the different construction subsectors. Once again, private housing was the standout sector, with positive contributions from private industrial and infrastructure. The public sector classifications and private commercial all posted sizeable negative yearly changes in both Q1 and Q2 2018. 

Most activity indicators maintain a story of sentiment holding up, despite a patchier outlook into 2019. The broad optimism may be reflective of current activity, which – looking across many urban skylines – displays a strength of activity. The visible manifestations of construction work give no indication of the pipeline of new work following on behind, though. Confident expectations for the next 12 months need backing up with continued capital expenditure and corresponding business investment sentiment. 

ICAEW’s UK Business Confidence Monitor for Q3 2018 supported this view on confidence, with the reading falling from -0.2 in Q3 to -12.3 in Q4 of 2018. Putting this into context, the Q4 reading is below the value recorded immediately after the EU referendum and is the lowest value in this index since Q2 2009. The ICAEW report suggests that a chill is being felt across all UK regions and almost all economic sectors, and is not differentiated by size of firm. Looking among the rubble, a glimmer of optimism for construction’s reading is that it is in the middle of the pack – it is not the sector with the most pessimistic current view. In addition to concerns around capacity and staffing, regulatory requirements are the standout area of concern in this latest survey. 

Construction topped the pile for insolvencies in the latest data release by the Insolvency Service for the 12 months ending in Q3 2018. The number of new insolvencies in the industry was 2,924 over this period. This was a 3.8% increase on the level recorded in Q2 2018.

04 / Building costs and prices

Tender-Price-Inflation

Tender prices rose over the year by 1.4% to Q3 2018. Construction price inflation trends are transitioning to a steady state towards the end of this latest economic and industry cycle. Naturally, higher prices are still sought by contractors, but competitive pricing will emerge in the market place as the acceptance of a flatter period of growth beds in. This is not to say prices will fall significantly: they may well not, if reasonable demand-side support remains. 

As the market finds a new level, some variability in tender spreads is expected to continue as more bidders weigh their forward orders and, consequently, begin to apply appropriate pricing tactics. But tender spreads are mostly still within expected ranges. Any discounting is not across the board, although some variability in pricing is becoming evident. Pricing of some early trades is less consistent, possibly mirroring the increasingly uncertain outlook into the medium term.

Despite more tactical responses in pricing among a smaller pool of contractors, it is expected that the overall view that tender prices are not set to fall, pipeline is good and sentiment is robust will continue for some time yet. Anything other than this suggests or implies a business vulnerability. But it is the firms in a weaker position that pose a threat to the collective ability of firms to take advantage of higher prices, such is the reliance on competitive tendering. 

Preliminaries, overheads and profit are largely at or near prevailing benchmark levels. All of these together confirm widely held views that the industry is still sound with respect to commercial trends. That preliminaries costs are still at recent benchmark levels also reflects the story around input cost pressures, particularly labour and staff. These pressures are complicated by the fact that selling prices are unable to keep pace with the rate of input cost inflation. It is expected that there will remain an inability to recover the full extent of these input cost pressures for a while yet, especially when competition is beginning to increase in some areas of the supply chain.

Enquiries across the supply chain are at reasonable levels, though a lower rate of conversion into orders is evident. General uncertainty across the political and economic landscape is the primary reason for this. Data for new orders at Q2 2018 supports this anecdotal evidence, as yearly and quarterly change metrics were both negative, at -7.4% and -6.5% respectively. 

Materials and labour input costs continue to rise. A composite index for building costs at Q3 2018 is up by 4% since the same quarter a year ago. Expectations of further increases across the remainder of 2018 and into early 2019 are high. Significant concerns on availability of labour and staff resources remain a key issue for many firms. Consequently, wage growth for trades continues to increase above rates for general consumer price inflation measures in the economy. Some differences in trends among site disciplines are evident, with early trades displaying weaker pay growth, if not a contraction over the year. Later trades in any build programme are still seeing strong demand, with corresponding wage growth.

Aecom’s baseline forecasts for tender price inflation are 1.0% from Q3 2018 to Q3 2019, and 1.2% from Q3 2019 to Q3 2020. The rate of tender price inflation over the year ahead will be influenced by: the level of risk accepted by the supply chain and how that is priced; whether discounting to current tender rates is palatable or achievable in order to secure work; further consolidation and capacity limitations of the supply chain; adverse movements in the sterling exchange rate; and damage to confidence from global economic shocks such as tariffs and political volatility. 

Future activity is expected to be modest in comparison with recent years. Elevated input costs from tight supply-side constraints will be the key factor that supports tender price inflation over the short term. Higher downside risk is expected to prices over the forecast periods, primarily because of political and economic uncertainty. An extended period of downside risk introduces new operational challenges. Whether to manage these through tender price channels will vex the supply chain next year.

The price forecasts are based on key assumptions: that construction output continues a downward trend towards a long-run mean; that future work is secured for contractors but with more flexibility on terms and conditions rather than significant price reductions; that UK economic conditions – both cyclical and Brexit-related – are a source of greater turbulence; government capital expenditure does not increase; and that sterling sees on-going fluctuations and remains lower for longer.