


While the initial bounce-back looks to be V-shaped, there are strong reasons to believe that could change in the medium term as downside risks materialise. Michael Hubbard of Aecom reports
01 / Summary
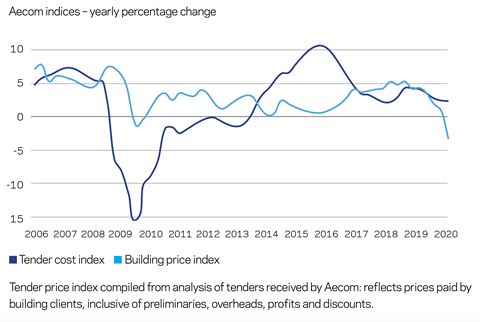
Tender price index ▲
Tender prices increased by just over 2% in the 12 months to Q2 2020. The outlook for tender prices is linked to the fallout from coronavirus lockdown but downside risks are higher.
Building cost index ▼
A composite measure of building input costs fell by 3.2% over the year to Q2 2020. Labour rates slipped significantly but have rebounded quickly as site activity picked up.
Consumer prices index ▲
The annual rate of change was 0.6% in June 2020. The lockdown brought significantly lower consumer activity and demand, and the current inflation rate remains well below its 2% target.
02 / Output
UK construction output
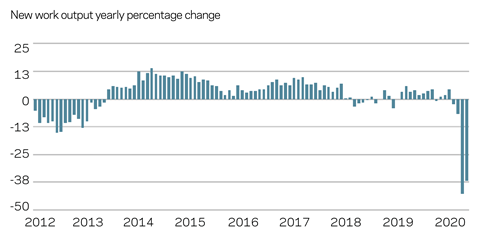
Latest construction output data from the Office for National Statistics (ONS) could lead with two distinct headlines if it chose. A positive angle is that construction output bounced back in May, increasing by 8.2% from April. This rebound in activity is strong, particularly given that the shutdown impacts were so large. As more sites reopened, extended working hours aided productivity to offset social distancing measures that acted as a drag to more efficient working. The intention is to maintain programmes or minimise delays, but amended operating procedures or changes to work plans inevitably brings additional costs somewhere along the supply chain.
The less good news in the output data is that the sector is still more than 30% smaller than it was at the turn of the year. Coronavirus and its lockdown impacts are writ large across the construction sector. A number of soft data indicators show that construction activity rebounded solidly in the circumstances. However, work backlog, employment outlook and underlying demand, once the V-shaped bounce‑back dissipates, warn of more downside risks further out.
03 / Activity indicators
Business sentiment
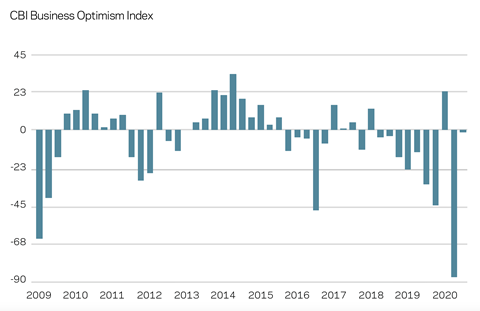
The first-stage effects of the pandemic are now evident. Almost every UK business sentiment indicator recorded historical lows, by some way, at the nadir of the lockdown. Many of these indicators stretch back decades, underscoring the extraordinary impacts of this period. Early assessments of the UK’s GDP annual growth rate outline the drop in economic activity. At Q1 2020 the rate of change was -1.7% over the year. However, it is almost certain that subsequent GDP data points will become gloomier before they improve.
Looking at the UK’s economic momentum before the coronavirus pandemic hit, it is becoming clear that the economy was notably weaker than 2019 and may have already started to contract going into 2020. Subdued consumer sentiment and excess precautionary saving has been a strong theme during the lockdown period. The uncertain economic outlook makes this entirely understandable. However, this particular dynamic will continue to act as a drag on overall economic activity in the UK, such is the reliance on the service sector to the UK economy. Similarly, uncertainty dents business confidence, and with it further questions or reduced likelihood of proceeding with capital investment. Construction activity is linked to capital investment.
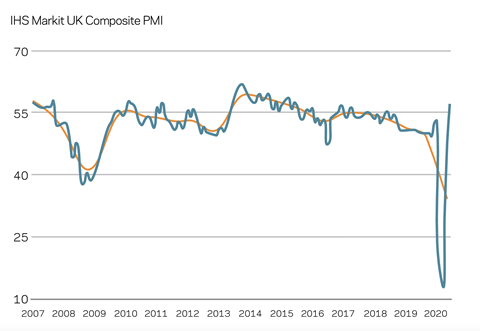
Since its dizzying fall immediately after the enforced lockdown, Markit’s composite PMI – a measure of manufacturing and service sector activity – has recovered all that decline in short order. In fact, its latest reading of 57.1 returns this index of UK economic activity above the readings prior to coronavirus. The bounce-back in sentiment is likely to be a mix of actual workload improvements and relief that economic activity has resumed. Sentiment surveys can therefore over-reach lagging hard data metrics at times of transition.
Sentiment surveys quite often use a net balance method, which results in a net figure of the balance of firms stating that their current situation is better than some historical reference point. However, they do not necessarily tell us the magnitude of the improvement in business activity and this might explain some of the strong rebound of late. Over-reading these sentiment surveys is a risk, then, potentially raising expectations too early. Current readings might not fully reflect the crushing reduction in economic activity as a result of the lockdown and the pandemic’s on-going challenges. Any discrepancy between these more frequent economic surveys and the hard data released in GDP assessments of the economy will become evident over the second half of 2020.
04 / Building costs
Exchange rates
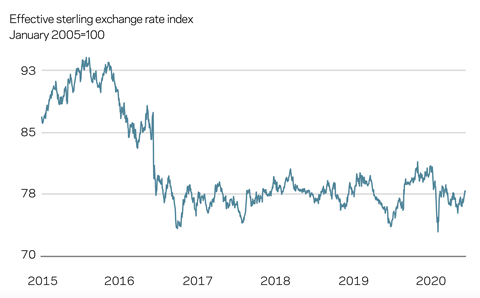
Although sterling gained against the US dollar, this is likely to be from selling pressure the dollar experienced over the past quarter. Down 8% since mid-March, the dollar index hit a two-year low more recently on concerns for the US economy and its coronavirus response. A weaker dollar usually means that commodity prices rise, given their correlation. Building input costs will see continuing or further upward inflationary pressure as the most likely outcome from this situation. But the dollar is not the only currency expected to see volatility. As the end of 2020 moves closer, sterling will see its own period of turbulence.
Quite often one currency’s woes are another’s dividend, and so it seems for the euro lately. A euro currency index has risen by 9% in six months, perhaps because the euro is perceived as a source of safety, along with the €750bn coronavirus recovery programme announced recently. What does this mean for sterling? Sterling will struggle to see the same level of support in the second half of 2020. Uncertainty for the UK exists in many areas, which markets typically do not like. The UK’s route out of the coronavirus trough and no-deal Brexit risks are two of the major risks or uncertainties that sterling will reflect over the second half of 2020.
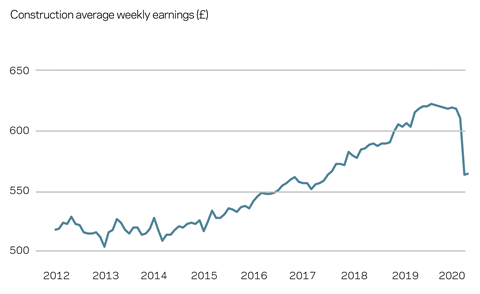
Inputs
Aecom’s composite index for building costs – comprised of materials and labour inputs – fell by 3.2% over the year to Q2 2020. The quarter-to-quarter change from Q1 to Q2 2020 also declined, by 2.9%. Primarily, the drop is because of substantial falls in wage rates. Wages are a function of overall construction demand, given the large labour-only component of the construction sector. The materials component of the index recorded a small increase of 0.8% year-on-year across all materials classifications. The largest notable decreases were in reinforcement bars at -10% and imported timber at -9.5%.
As site activity has picked up, above-average building cost inflation has hit several materials classifications. A combination of restart demand, some enduring lockdown constraints and low supply inventories have conspired to create tight supply conditions for these materials. It is not clear whether this is predominantly because of domestic or import issues. Nonetheless, elevated input cost inflation is likely to persist while supplier and distribution channels are dislocated.
05 / Tender prices
Resources
Tender pricing variability increased marginally over the first half of 2020. But the exceptional situation of Q2 and the economic slump have not yielded commensurate changes in tender pricing yet. Tender prices increased by just over 2% in the 12 months to Q2 2020. This is the slowest pace of tender price inflation for two years. Lower prevailing rates for preliminaries and other on-cost items contributed to this more gradual level of price inflation. In the short term, it is very plausible that the major trend for tender pricing sees it step over the lockdown period and resume its pre-existing path, now that site activity is resuming. Correspondingly, any material adjustment to future pricing trends is going to take place in response to a longer or sustained period of depressed construction activity. The strength of new orders over the second half of 2020 will influence this, and the effect of any wider economic risks percolating through to industry sectors requiring construction services.
External factors will eventually influence pricing decisions. Current and expected headwinds for firms are significant. Internal firm issues are pronounced too. Commercial tension endures as to whether elevated input costs can be recovered through higher prices. Matching cost bases to predicted work volumes is now a dilemma. Margin compression is increasingly evident, but not solely because of the coronavirus lockdown. Indeed, financial statements released by supply chain firms all highlight the risks to future revenues, if they have not already materialised, and the on-going pressure to margins. This theme is expected to continue over the next 12 months at least. Absolute margin levels quite often are something to trumpet in financial statements; now their relative position to industry peers is sometimes used instead to provide context.
05 / Outlook
The Office for Budget Responsibility’s (OBR) first assessment in May of the forecast hit to construction might end up being overdone. Nevertheless, this should not detract from the extensive impact made to the sector from the lockdown. Site shutdowns, restrictions on the movement of people, goods and materials all conspired to draw heavy clouds over the sector. Supply chain firms reacted quickly to invoke operational and financial mitigations. Trading updates released more recently make clear the effects on site activity of the lockdown, and the muted, if not stark, assessments of trading for the rest of 2020.
An economic rebound is under way, but scarring to the economy as a result of the lockdown fallout is evident. Flow-through to the construction sector and demand for its services will inevitably follow. Some projects have been paused and further consequences for workload can be expected from decisions yet to be taken or announced. Without question, though, sound construction output momentum going into the lockdown has been lost.
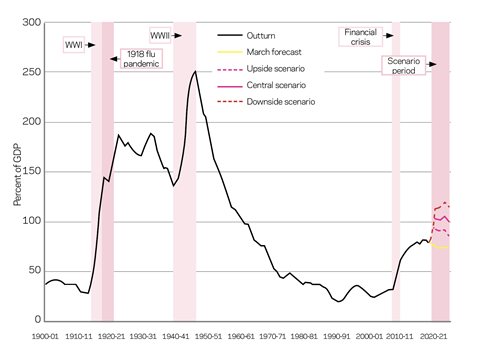
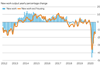
Public sector net debt
Coronavirus scenarios versus March forecast
How does the rebound turn into a sustained recovery? Countercyclical policies are a starting point, to offset falls in aggregate demand and related private sector-led investment. Construction can and will be used to pump‑prime the economy with so-called shovel-ready projects. Policy stimulus for housing, as in 2013, is likely but the efficacy of this will be determined to some extent by personal finances and whether these have been impaired by the lockdown.
Private sector investment often correlates to prevailing levels of uncertainty. Construction firms with larger exposures to private sector capital investment construction do have a commensurately bigger risk to future workload if weaker economic trends take hold. With trade-offs to make around public finances – or “tough choices”, according to the chancellor – there is not a guarantee that public sector expenditure will fully save the day either. Doubtless the public sector will be seen as a source of steadier workload for construction firms over the next couple of years.
Future building use dilemmas are also an emerging risk, which the lockdown and social psychology has introduced. A doughnut-shaped lockdown has developed whereby city centres are less busy while enclosing suburban areas are bustling. The psychology and decision-making attached to commuting and working location arrangements in a pandemic appear to be significant enough in their potential to adjust future demand for commercial office space.
Aecom’s initial alphabet of scenarios published in the previous market forecast (Building, 5 June, pages 50-53) set the picture for possible routes through the pandemic-hit economy and construction sector. Updated scenarios are outlined below. The initial bounce-back has plotted a V-shape, at least in terms of sentiment.
Subsequent GDP data will confirm the strength of this sentiment rebound. Further out the complete story may yet be W-shaped, especially once Brexit impacts come into play. There is a higher probability then of deflationary price trends if the prospects fade for sustained economic recovery after the V-shaped bounce-back.
That said, the probability of the eventual path being a blend of the letter-based scenarios is increasing. There is the intriguing possibility of one morphing into another. Because of the unparalleled situation in which we find ourselves, it is wise to differentiate between the reaction over the very short term, in this case two to three months of the lockdown, and the response that stretches over the medium term – 12-18 months in this instance.
Scenario 1: Quick rebound and no enduring economic impacts
Outline:
- A short-term pause, albeit significant, is suffered in existing construction activity.
- Activity and output return to near previous levels by Q4 2020, settling at an industry long-run average.
- No further lockdowns country-wide are implemented.
- The lockdown fallout does not develop into a prolonged financial crisis through a negative feedback loop.
- Post-lockdown construction demand remains broadly in place.
Effects and outcomes:
- Lower site productivity is experienced due to social distancing measures on sites.
- Some reduced supply chain capacity acts as an offsetting factor that applies upward pressure to tender prices.
- Tender pricing sees softer trends over the remainder of 2020, but the yearly run rate is still positive. As construction activity picks up once more, tender price levels begin to head towards longer-run averages and with the potential for short-term tender price spikes where supply and demand converge quickly to influence tender price inflation.
TPI forecasts:
2020 0% to 1%
2021 2% to 3%
2022 3% to 5%
Scenario 2: Slower recovery after initial V-shaped sentiment rebound
Outline:
- Early sentiment and activity spike fades as weaker economic trends emerge.
- Monitoring and suppression is the over-arching approach as lockdown severity eases, but the potential remains for further country-wide or localised lockdowns where necessary.
- Construction output does not return to similar levels to those immediately prior to the coronavirus outbreak until 2021 at the earliest.
- Broader economic disruption is sufficiently large that related construction demand, either directly or indirectly, is notably impacted.
- Operational and productivity impacts continue from social distancing, monitoring and suppression mitigations.
Effects and outcomes:
- Input costs maintain long-run average or above-average yearly rates of change, because of supply constraints and exchange rate fluctuations.
- Reduced supply chain capacity, either through insolvencies or restrictions on delivery capability, is a significant offsetting factor that applies upside risk to tender prices.
- Tender prices experience downside pressure over the short term due to restrictions on activity, lower output and some knock-on effects to overall demand. For similar reasons, supply-side effects produce some upside risk but overall tension for the supply chain to win work and secure cash leads to competitive tendering – and possibly even subeconomic pricing in some instances.
TPI forecasts:
2020 -2% to 1%
2021 -1% to 1%
2022 1% to 3%
Scenario 3: Significant downturn followed by slow recovery
Outline:
- Without a vaccine, coronavirus continues its presence in society, the risk of infection transfer remains, and further waves of infection occur in response to attempts at easing social distancing measures.
- Any discernible rebound in construction activity, let alone a recovery, does not occur until late 2021. Similarly, UK GDP remains well below par and recessionary for an extended period.
- A negative feedback loop develops where the lockdown generates economic scarring and the consequences cut across economic sectors, adding to overall downside risks. In turn, aggregate construction demand falls materially.
Effects and outcomes
- Tender prices enter a deflationary trend over the short and medium term. Pressure to secure workload and cash flow outweighs the often-stated objectives of targeting higher-margin work. Subeconomic pricing therefore becomes more prevalent.
- Input cost trends remain higher than prevailing rates of tender prices largely due to weaker sterling, further complicating the commercial dynamic.
- Some upside price pressure is applied to tender pricing from tighter supply chain capacity, but not to a greater extent than competitive pressure to secure workload in a declining market. Changes to sourcing and buying are necessary – locations and frequency for example – because of global supply chain problems and on-going dislocations.
TPI forecasts:
2020 less than 0%
2021 less than -4%
2022 -2% to 2%

No comments yet