


A full breakdown of current schools funding and the outlook for the next five years
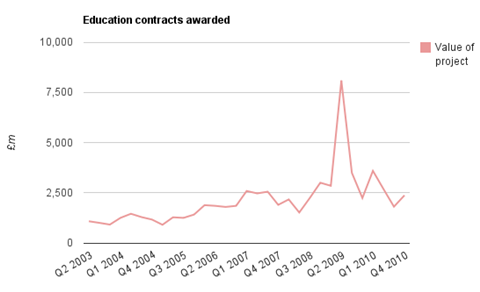
The last quarter of 2010 offered some improvement for those working in the education sector (see graph below). Research from Barbour ABI shows that contract awards were up more than 25% on the previous quarter, although at a total of £2.4bn the workload remained at a relatively low level.
State secondary schools accounted for the biggest proportion of work – 41% - as schemes that survived the cull of the Building Schools for the Future programme continued to progress. (See table at bottom of page).
The outlook
The government’s capital spending on education will decrease steadily from this April, with settlements reached in the Comprehensive Spending Review showing a drop of around 60% from 2010-11 levels by 2014-15. The funding settlements agreed are:
- 2010-11: £7.6bn
- 2011-12: £4.9bn
- 2012-13: £4.2bn
- 2013-14: £3.3bn
- 2014-15: £3.4bn
Of the funds available for 2011-12, £2.1bn has already been divided up between local authorities to spend on maintenance and the creation of new school places. Funding pots were £1.3bn and £800m respectively, although local authorities are able to switch funding between the two areas if they wish.
The remaining £2.8bn will be used to fund BSF projects and academies that have already been told they can proceed, together with sixth forms and new free schools. This includes some of the £800m pipeline of academies which were granted approval earlier this year after being put on hold, with the schemes set to be phased over the next two years.
The government has said that it expects the total levels of maintenance funding and “basic need” – ie money allocated to meet demand for extra school places – to remain broadly flat during the spending review period.
This means that the total money available for larger refurbishment projects or new build will fall to around £1.2bn in 2013-14 – so below half current levels.
The methods for prioritising schools funding will be outlined in the Sebastian James review findings, but criteria will be based much more around building condition than before.
And as the cuts hit home, the balance of work is likely to shift towards primary schools, which – as well as being smaller, cheaper projects - the government has made a priority for funding due to the pressure on primary school places.
Education contracts awarded by type Oct-Dec 2010
| Region | Nurseries | State Primary | State Secondary | Private Schools/ Colleges | Colleges/ Universities | Special Schools | Total Value | % of Value |
|---|---|---|---|---|---|---|---|---|
| SE & London | £8,100,000 | £112,517,500 | £317,500,000 | £11,200,000 | £191,150,000 | £29,317,500 | £669,785,000 | 28% |
| Northern England | £600,000 | £80,820,000 | £261,747,500 | £18,550,000 | £113,360,000 | £12,000,000 | £487,077,500 | 21% |
| South West & Wales | £2,350,000 | £391,375,000 | £107,825,000 | £41,340,000 | £92,100,000 | £11,700,000 | £646,690,000 | 27% |
| Midlands & East Anglia | £3,900,000 | £80,491,245 | £220,300,000 | £8,500,000 | £138,600,000 | £11,550,000 | £463,341,245 | 20% |
| Scotland | £750,000 | £30,210,000 | £68,395,000 | £0 | £5,500,000 | £210,000 | £105,065,000 | 4% |
| Total | £15,700,000 | £695,413,745 | £975,767,500 | £79,590,000 | £540,710,000 | £64,777,500 | £2,371,958,745 | |
| % of Total | 1% | 29% | 41% | 3% | 23% | 3% | ||
Education White Paper

Following the government’s response to the James Review. The 60 page report includes analysis of proposed procurement, design and regulatory changes as well as local authorities with the biggest shortage of school places and much more


No comments yet