


Costing Steelwork is a series from Aecom, BCSA and Steel for Life that provides guidance on costing structural steelwork. This quarter provides a market update and updates the five cost models previously featured in Costing Steelwork
Click here to read the full costing report
Construction new work output increased by over 2% in the year to Q1 2023, according to the latest data release from the Office for National Statistics. All sub-sectors recorded expansion over the 12-month period to Q1, underscoring the resilience of activity across the industry in the early part of 2023. The only exception to this was public sector housing, which saw a reduced volume. Repair and maintenance work posted very strong growth at almost 8%. This is significant as the repair and maintenance sub-sector is an important and meaningful contributor to overall industry workload. Ongoing higher volumes here add to workforce pressures elsewhere in the industry, and their corresponding influence on other market dynamics.
The industry’s largest sub-sector – private housing – declined by 7% since its peak output in Q3 2022, indicating that this sub-sector is slowing materially now. Yet looked at another way, and measured against historical output trends, private housing continues to record substantial output volume each quarter. This said, the outsize influence of private housing activity and any adverse changes will impact headline data measures. Nominally, there is still good industry output at an aggregate level, which the various industry sentiment surveys reflect. As a result, construction sector sentiment continues to hold a position at or around its long-run average.
Two contributing factors to this prevailing view across the industry – output volume, albeit slowing in some sub-sectors, and the industry’s enduring supply chain constraints – are combining still to create the feeling that the industry remains busy more or less. The most revealing aspect of latest sentiment surveys is the mixed picture that they report. Whereas for a long time most sectors have moved with the same trend direction, now momentum is adjusting across sub-sectors. The construction sector overall continues to offer sound workload, especially for those supply chain firms that can work across sectors.
Since the end of 2022, the absence of any one-off adverse events has helped to maintain the industry’s momentum and resilience. However, a looming issue that will affect industry activity, and which has been growing in effect for several quarters now, is the rising interest rate environment. This backdrop of higher interest rates is starting to reach the construction sector. Significant volumes of construction activity relates to capital that is linked to or influenced by interest rates. It would be remarkable for aggregate construction activity not to be impacted by the higher interest rate backdrop. Tighter and costlier financing conditions will impact a capital-intensive industry. The ramifications of the higher interest rate environment, which started to gain momentum in the first quarter of 2022, will become increasingly evident from here on. There is a high likelihood that these lagged effects will begin to dominate discussions this year and into 2024 around the outlook for the construction sector and the economy, along with any associated decision-making processes.
The underlying inflationary pressures across the construction trades are easing. Aecom’s building cost index – a composite measure of materials and labour costs – increased by 2.3% over the 12 months to May 2023. The quarterly aggregated measure returns a significantly different percentage change value at 7% to 8% between Q1 2022 and Q1 2023. A broad range of inflationary rates is still evident across the basket of items. However, slower trends are being recorded across a larger number of materials categories. This is good news that helps the industry’s purchase of inputs to the construction process, though it is still taking time for the momentum change to apply across all input cost categories. The index is a blend of materials and labour, with the two components seeing some divergence in trend. Workforce wages inflation continues to plot its steady course of increases. After a peak in Q1 this year at a broadly 6% to 7% yearly change, a marginally slower rate of inflation is in force in the latest ONS data, returning to somewhere near its medium-term trend of 5%.
Aecom’s tender price inflation index rose by 9.6% over the 12 months to Q2 2023. This is a marginally slower rate of inflation over the rolling 12-month measurement period than the previous four quarters. Although this offers some relief from the chronic inflationary environment, it is still a high rate of price change by historical measures. Tender returns analysed by Aecom continue to demonstrate firm rates of price change. Comfortable workload trends across an industry with notable capacity constraints are all working to underpin the price inflation story. Added to this, input cost inflation is still elevated, and compared with historical benchmarks, there is some way to go before tender price inflation trends return to longer-run levels.
Although input cost inflation is improving and descending from its acute levels of the last two years or so, tender price inflation is not yet adjusting as quickly and following a similar declining trend. It will persist at elevated levels over 2023. Current workload momentum and ongoing elevated input inflation will act to support tender price inflation trends generally. Aecom’s baseline forecast for tender prices is a 4.3% increase from Q3 2023 to Q3 2024, and a 3.3% increase from Q3 2024 to Q3 2025. The core assumptions to the forecasts are that industry activity continues to level off but not fall substantially, and that the economy maintains a muted path. The balance of risks to forecasts of price trends is balanced evenly now over both of the 12-month forecast periods.
There are signs of optimism around certain elements, particularly steelwork which has seen the raw cost decrease significantly.
Figure 1: Tender price inflation, Aecom Tender Price Index, 2015=100
| Forecast* | |||||||
|---|---|---|---|---|---|---|---|
|
Quarter |
2019 |
2020 |
2021 |
2022 |
2023 |
2024 |
2025 |
|
1 |
117.9 |
120.4 |
120.0 |
131.2 |
145.3 |
152.7 |
158.7 |
|
2 |
118.3 |
121.0 |
122.6 |
134.5 |
147.6 |
154.2 |
159.9 |
|
3 |
119.3 |
119.1 |
125.3 |
138.1 |
149.5 |
155.8 |
160.9 |
|
4 |
119.8 |
119.1 |
127.5 |
142.3 |
151.2 |
157.3 |
162.1 |
Sourcing cost information
Cost information is generally derived from a variety of sources, including similar projects, market testing and benchmarking. Due to the mix of source information it is important to establish relevance, which is paramount when comparing buildings in size, form and complexity.
Figure 2 represents the costs associated with the structural framing of a building, with a BCIS location factor of 100 expressed as a cost/m² on GIFA. The range of costs represents variances in the key cost drivers. If a building’s frame cost sits outside these ranges, this should act as a prompt to interrogate the design and determine the contributing factors.
The location of a project is a key factor in price determination, and indices are available to enable the adjustment of cost data across different regions. The variances in these indices, such as the BCIS location factors (figure 3), highlight the existence of different market conditions in different regions.
To use the tables:
1. Identify which frame type most closely relates to the project under consideration
2. Select and add the floor type under consideration
3. Add fire protection as required.
For example, for a typical low-rise frame with a composite metal deck floor and 60 minutes’ fire resistance, the overall frame rate (based on the average of each range) would be:
£166.00 + £110.50 + £28.00 = £304.50
The rates should then be adjusted (if necessary) using the BCIS location factors appropriate to the location of the project.
Figure 2: Indicative cost ranges based on gross internal floor area
| TYPE | Base index 100 (£/m2) | Notes |
|---|---|---|
|
Frames |
||
|
Steel frame to low-rise building |
150-182 |
Steelwork design based on 55kg/m2 |
|
Steel frame to high-rise building |
252-285 |
Steelwork design based on 90kg/m2 |
|
Complex steel frame |
285-337 |
Steelwork design based on 110kg/m2 |
|
Floors |
||
|
Composite floors, metal decking and lightweight concrete topping |
86-135 |
Two-way spanning deck, typical 3m span with concrete topping up to 150mm |
|
Precast concrete composite floor with concrete topping |
132-185 |
Hollowcore precast concrete planks with structural concrete topping spanning between primary steel beams |
|
Fire protection |
||
|
Fire protection to steel columns and beams (60 minutes resistance) |
23-33 |
Factory applied intumescent coating |
|
Fire protection to steel columns and beams (90 minutes resistance) |
27-44 |
Factory applied intumescent coating |
|
Portal frames |
||
|
Large-span single-storey building with low eaves (6-8m) |
109-143 |
Steelwork design based on 35kg/m2 |
|
Large-span single-storey building with high eaves (10-13m) |
133-170 |
Steelwork design based on 45kg/m2 |
Figure 3: BCIS location factors, as at Q2 2023
| Location | BCIS Index | Location | BCIS Index |
|---|---|---|---|
|
Central London |
127 |
Nottingham |
102 |
|
Manchester |
102 |
Glasgow |
92 |
|
Birmingham |
96 |
Newcastle |
90 |
|
Liverpool |
97 |
Cardiff |
94 |
|
Leeds |
92 |
Dublin |
90* |
*Aecom index
Steel For Life sponsors
Cost comparison updates
This quarter’s Costing Steelwork provides an update of the five previously featured cost comparisons covering: offices, education, industrial, retail and mixed-use
These five projects were originally part of the Target Zero study conducted by a consortium of organisations including Tata Steel, Aecom, SCI, Cyril Sweett and the BCSA in 2010 to provide guidance on the design and construction of sustainable, low- and zero-carbon buildings in the UK. The cost models for these five projects have been reviewed and updated as part of the Costing Steelwork series. The latest cost models as of Q3 2023 are presented here.
Costing steelwork: offices update
Below is an update to the offices cost comparison originally published in the Costing Steelwork Offices feature in Building magazine in April 2017.
One Kingdom Street, London, key features
- 10 storeys, with two levels of basement
- Typical clear spans of 12m x 10.5m
- Three cores – one main core with open atrium, scenic atrium bridges and lifts
- Plant at roof level
Cost comparison
Two structural options for the office building were assessed (as shown in figure 4):
- Base case – a steel frame, comprising fabricated cellular steel beams supporting a lightweight concrete slab on a profiled steel deck
- Option 1 – 350mm-thick post-tensioned concrete flat slab with a 650mm x 1,050mm perimeter beam.
The full building cost plans for each structural option have been reviewed and updated to provide current costs at Q3 2023. Over the course of the year increased costs have been largely offset by contractors working on reduced or no margin. The costs, which include preliminaries, overheads, profit and a contingency, are summarised in figure 4.
The cost of the steel composite solution is 3% higher than for the post-tensioned concrete flat slab alternative for the frame and upper floors, but 2% lower on a total building basis. The lighter frame and faster erection result in reduced foundations and a shorter programme. The latter is the main reason for the lower cost.
Figure 4: Key costs £/m² (GIFA), for City of London office building
| Elements | Steel composite | Post-tensioned concrete flat slab |
|---|---|---|
|
Substructure |
93 |
98 |
|
Frame and upper floors |
569 |
563 |
|
Total building |
3,618 |
3,704 |
Costing steelwork: education update
Below is an update to the education cost comparison originally published in the Costing Steelwork Education feature in Building magazine in July 2017.
Christ the King Centre for Learning, Merseyside, key features
- Three storeys, with no basement levels
- Typical clear spans of 9m x 9m
- 591m2 sports hall (with glulam frame), 770m2 activity area and atrium
- Plant at roof level
Cost comparison
Three structural options for the building were assessed (as shown in figure 5), which include:
- Base case – steel frame, 250mm hollowcore precast concrete planks with 75mm structural screed
- Option 1 – in situ 350mm reinforced concrete flat slab with 400mm x 400mm columns
- Option 2 – steel frame, 130mm concrete topping on structural metal deck.
The full building cost plans for each option have been updated to provide current costs at Q2 2023. The comparative costs highlight the importance of considering total building cost when selecting the structural frame material.
The concrete flat slab option has a lower frame and floor cost compared with the steel composite option, but on a total-building basis, the steel composite option has a lower overall cost of £4,013/m² against £4,049/m². This is because of lower substructure and roof costs, alongside lower preliminaries resulting from the shorter programme.
Figure 5: Key costs £/m² (GIFA), for Merseyside secondary school
| Elements | Steel + precast hollow-core planks | In situ concrete flat slab | Steel composite |
|---|---|---|---|
|
Frame and upper floors |
381 |
322 |
341 |
|
Total building |
4,090 |
4,049 |
4,013 |
Costing steelwork: industrial update
Below is an update to the industrial cost comparison originally published in the Costing Steelwork Industrial feature in Building magazine in October 2017.
Distribution warehouse in ProLogis Park, Stoke-on-Trent, key features
- Warehouse: four-span, steel portal frame, with a net internal floor area of 34,000m2
- Office: 1,400m2, two-storey office wing with a braced steel frame with columns
Cost comparison
Three frame options were considered:
- Base option – a steel portal frame with a simple roof solution
- Option 1 – a hybrid option: precast concrete column and glulam beams with timber rafters
- Option 2 – a steel portal frame with a northlight roof solution.
The full building cost plans for each option have been updated to provide costs at Q3 2023. The steel portal frame provides optimum build value at £920/m²; glulam is least cost-efficient. This is primarily due to the cost premium for the structural members necessary to provide the required spans, which are otherwise efficiently catered for in the steelwork solution.
With a hybrid, the elements are from different suppliers, which raises the cost. The northlights option is directly comparable with the portal frame in relation to the warehouse and office frame. The variance is in the roof framing as the northlights need more of this. Other additional costs relate to the glazing of the northlights.
Figure 6: Key costs £/m2 (GIFA), for Stoke-on-Trent distribution warehouse
| Elements | Steel portal frame | Glulam beams + purlins + concrete columns | Steel portal frame + north-lights |
|---|---|---|---|
|
Warehouse |
123 |
187 |
143 |
|
Office |
188 |
227 |
188 |
|
Total frame |
127 |
189 |
145 |
|
Total building |
920 |
995 |
964 |
Costing steelwork: retail update
Below is an update to the retail cost comparison originally published in the Costing Steelwork retail feature in Building magazine in January 2018.
Asda food store, Stockton-on-Tees,
key features
- Total floor area of 9,393m2
- Retail area based on 12m x 12m structural grid
Cost comparison
Three frame options were considered (as shown in figure 7) to establish the optimum solution for the building, as follows:
- Base option – a steel portal frame on CFA piles
- Option 1 – glulam timber rafters and columns on CFA piles
- Option 2 – a steel portal frame with a northlight roof solution on driven steel piles.
The full building cost plans for each option have been updated to provide costs at Q3 2023. The steel portal frame provides the optimum build value at £3,345/m², with the glulam option the least cost-efficient. The greater cost is due to the direct comparison of the steel frame solution against the glulam columns and beams/rafters. A significant proportion of the building cost is in the M&E services and fit-out elements, which reduce the impact of the structural changes.
The northlights option is directly comparable with the portal frame in relation to the main supermarket – the variance is in the roof framing as the northlights require more. Additional costs beyond the frame are related to the glazing of the northlights and the overall increase in relative roof area.
Figure 7: Key costs £/m2 (GIFA), for Stockton-on-Tees food store
| Elements | Steel portal frame | Glulam timber rafters + columns | Steel portal frame + north-lights |
|---|---|---|---|
|
Structural unit cost |
185 |
233 |
209 |
|
Total building unit cost |
3,345 |
3,401 |
3,358 |
Costing steelwork: mixed-use update
Below is an update to the mixed-use cost comparison originally published in the Costing Steelwork mixed-use focus feature in Building magazine in April 2018.
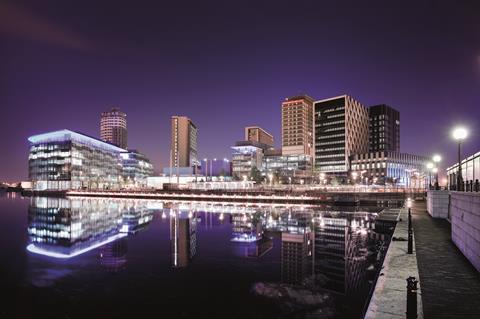
Holiday Inn tower, MediaCityUK, Manchester
- 17-storey tower
- 7,153m2 of open-plan office space on five floors (floors two to six)
- 9,265m2 of hotel space on eight floors (floors eight to 15)
The gross internal floor area of the building is 18,625m2. The 67m-high building is rectilinear with approximate dimensions of 74m x 15.3m.
Cost comparison
Three frame options were considered to establish the optimum solution for the building:
- Base option – steel frame with Slimdek floors
- Option 1 – concrete flat slab
- Option 2 – composite deck on cellular beams (offices) and UCs used as beams (hotel).
The full building cost plans for each option have been updated to provide costs at Q3 2023. The steel frame with composite deck continues to provide the optimum build value, with the overall building cost at £3,431/m2.
Options 1 and 2 are arguably more typical for this building type. The base case structure is an unusual solution due to a decision to change the residential accommodation to office floors at a very late stage – time constraints precluded redesign of the tower block, hence the original Slimdek design was constructed.
Figure 8: Key costs £/m2 (GIFA), for hotel/office building in Manchester
| Elements | Steel frame with Slimdek | Concrete flat slab | Composite deck on cellular beams (offices) and UCs used as beams (hotel) |
|---|---|---|---|
|
Structural unit cost |
688 |
500 |
470 |
|
Total building unit cost |
3,705 |
3,492 |
3,431 |
This Costing Steelwork article produced by Patrick McNamara (director) and Michael Hubbard (associate) of Aecom is available at www.steelconstruction.info.
The data and rates contained in this article have been produced for comparative purposes only and should not be used or relied upon for any other purpose without further discussion with Aecom. Aecom does not owe a duty of care to the reader or accept responsibility for any reliance on the article content


No comments yet