


The indications are that there’s still a way to go before we’re out of the woods, but there are small signs of improvement, reports Experian Business Strategies
01 / the state of play
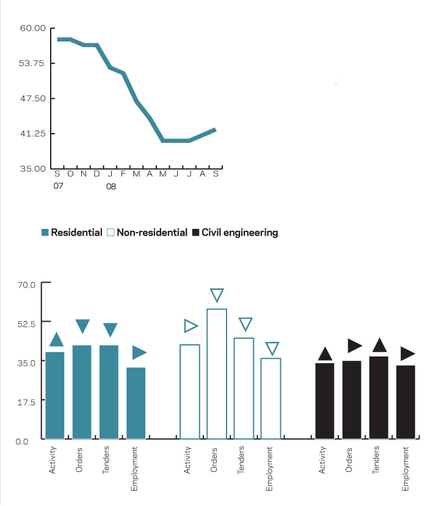
Conditions in the construction industry remained weak in July. However the situation appears to have stabilised, with the overall activity index unchanged from the low of 40 recorded in the past two months.
That said, forward-looking indicators deteriorated during the month, indicating that a recovery is not imminent. The orders index fell to 46, only the second time it has been below 50 in 12 years. This suggests that a high proportion of respondents reported a drop in orders. The tender enquiries index declined again, falling two points to 41.
The non-residential sector’s recent resilience continued to falter in July, as the activity index remained below 50 for the fourth successive month and both the orders and tender enquiries indices declined. However, the orders index remained above 50, despite a 10 point fall.
Residential orders were below the average for this time of year, and the index fell further in July to its lowest since October 1993. The tender enquiries index for the sector also declined, although it was down only two points on the previous month. Activity continued to contract, but the index edged up to 39.
The civil engineering sector improved slightly after the recent strong falls in the activity and orders indices. The activity index rose four points to 34, and the orders index stabilised at 35. The tender enquiries index was three points higher than June at 37.
The employment prospects index steadied at 35, which ended six consecutive months of decline.
02 / leading construction activity indicator
Experian Business Strategies’ Leading Activity Indicator, a short-term industry forecasting model, predicts that construction activity will continue to contract in the short term, although the rate of decline is expected to slow. After steadying in August, the indicator is predicted to rise slowly in September and October.
The Leading Activity Indicator also uses a base level of 50 – above that level shows an increase, below that level a decrease.
03 / labour costs
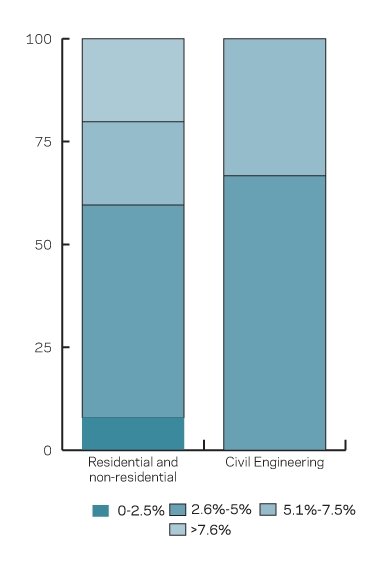
Two-thirds of civil engineering firms reported that annual labour cost inflation was between 2.6% and 5% in July. Thirty-three per cent of firms saw labour cost inflation of between 5.1% and 7.5%. This is an improvement on the last quarter, when 19% indicated that annual labour cost inflation was more than 7.6%.
On average, building firms fared worse than their civil engineering counterparts in July with 20% saying that the annual rate of labour cost inflation was more than 7.6%. This was worse than the situation three months ago, when 15% of firms fell into this band.
In July, 20% of building respondents reported annual labour cost inflation of between 5.1% and 7.5%, whereas 52% fell into the 2.6% to 5% band. Just 8% of building firms indicated annual labour cost inflation of less than 2.5%.
04 / regional perspective
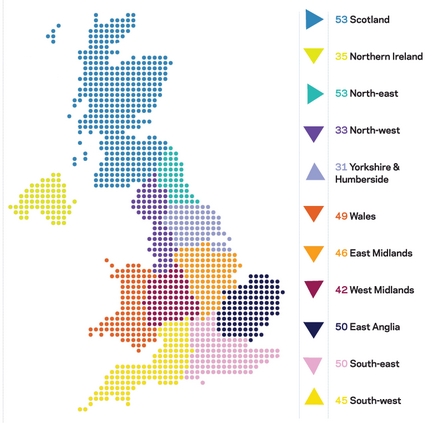
There were varied performances across the regions in July. A number experienced marked declines, while others improved slightly.
Experian Business Strategies’ regional composite indicators declined in seven of the 11 regions during the month. This measures current activity levels, the state of order books and the number of tender enquiries received by contractors to provide a measure of the relative strength of each regional industry.
The sharpest fall was in Northern Ireland, where the indicator declined nine points to 35. That indicator has fallen 35 points in just three months. There was also a marked decline in the East Anglia region – the indicator fell seven points to 50. The West Midlands and the North-west indicators each fell by one point, whereas the South-east declined by two points. The East Midlands and Wales indicators dropped below the 50 mark, with readings of 46 and 49 respectively. The indicators remained unchanged at 53 in the North-east and Scotland.
Yorkshire & Humberside is still the weakest region, although its indicator edged up from June’s record low to 31. The South-west was the only other region to register an increase, with the indicator one point higher at 45.
Postscript
This an extract from the monthly Focus survey of construction activity undertaken by Experian’s Business Strategies division on behalf of the European Commission as part of its suite of harmonised EU business surveys. The full survey results and further information on Experian Business Strategies’ forecasts and services can be obtained by calling 0870 1968 263 or logging on to www.business-strategies.co.uk
The survey is conducted monthly among 800 firms throughout the UK and the analysis is broken down by size of firm, sector of the industry and region. The results are weighted to reflect the size of respondents. As well as the results published in this extract, all of the monthly topics are available by sector, region and size of firm. In addition, quarterly questions seek information on materials costs, labour costs and work in hand.


No comments yet