


Some of our smallest everyday choices can have a huge impact on carbon emissions within and beyond the built environment. Juan J Lafuente and Theodore Darviris of Sturgis Carbon Profiling explore the cumulative effect of lifestyle choices on our carbon footprint
01 / Introduction
Every day we make lifestyle choices - such as the coffee we prefer every morning or the new gadget we buy. Most have a very small carbon impact as single actions. However, the cumulative effect of everyday habits often generates a greater environmental impact than homes and the offices we occupy.
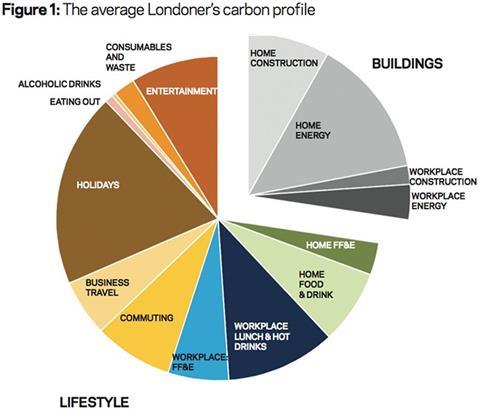
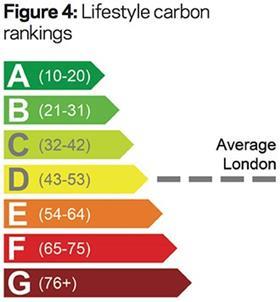
The following graph shows the carbon impact of an average Londoner’s lifestyle choices. Results have been extracted from a recent project in which Sturgis Carbon Profiling was commissioned by developer Argent to quantify not only the carbon emissions of the buildings it is creating in King’s Cross, but also the carbon footprint of the new community established there.
This footprint included all people living, working and studying in the area, and as part of the same project the profile of the average Londoner was also defined. Calculations are not based on estimations, but on direct answers to questionnaires on lifestyle routines and building consumption data.
Results revealed that 72% of the carbon emissions caused by the average Londoner come from lifestyle choices as opposed to 28% from buildings. In fact, the average Londoner’s carbon emissions from holiday travelling is very similar to the carbon impact of their home.
The global impact of the carbon emissions generated by Londoners is not small. Annual carbon emissions in London reach 17,850kg CO2e per person, which is 4.5 times more carbon intensive than the average person on the planet. It would require a forest as large as both Great Britain and Ireland combined to balance the environmental damage that 8.5 million Londoners are causing.
02 / Lifestyle choices and the built environment
- Most carbon emissions are generated by lifestyle choices, not by buildings
According to the chart above the proportion of emissions generated by construction and operation of buildings is very narrow in comparison with lifestyle choices. Aiming to improve energy efficiency in the built environment is of course the right thing to do, but the scope should also include lifestyle emissions because they are greatly influenced by the built environment and they may be more affordable to reduce. The attention that the government gives to building efficiency is mainly focused on the emissions caused by heating, cooling and fixed artificial lighting, which misses the opportunity to reduce the larger emissions caused by these other sources. However, regulating them could be controversial.
- Statutory regulation of lifestyle choices would face a complex agenda and strong opposition
Lifestyle choices are the result of personal preferences and corporate decisions. Trying to regulate the capacity of people to consume will generate ideological confrontations about personal freedom. Furthermore, lifestyle choices involve a huge variety of sectors, setting up several layers of complexity to actually implement statutory changes. Even if these two issues were overcome, time frame will also need to be carefully considered. Smoking kills, but it took decades until a law banning smoking in public buildings could be successfully passed. Carbon emissions do not directly kill us. It is impossible to predict how long it could take public opinion to accept statutory intrusions in their capacity to choose. Reduction of carbon emissions caused by lifestyle choices will need to be promoted through other channels beyond statutory regulation.
- Income effect on carbon intensity: capacity to purchase and availability of choices
Our culture’s purchase capacity and consumerist character encourages us to emit more, sometimes even jeopardising the positive effect of well-intentioned incentives. Saving carbon at home reduces our bills and puts some extra money in our pockets. However, we may choose to spend that extra income on a more carbon-intensive activity, such as flying to a European capital. Flying is normally cheaper than other less carbon-intensive options such as trains, so in this case we would normally select the carbon-intensive option. Therefore, flying will still leave some money in our pocket that may be consumed in some other carbon-intensive activity, increasing our footprint even more. The carbon savings from energy efficiency in our home may have been gone before we step on the plane.
This example can be extrapolated to almost any lifestyle choice. There is always a wide range of possibilities available for anything on offer: car models, holiday packs, menu options, and so on. Some of these options will probably be very carbon-intensive and there will be a group of people that will choose them - aware or unaware of this environmental impact. Inexpensive but carbon intensive products are not the right choice, but most of the time we do not know how to identify them and we don’t have the economic incentive to do it.
- Communication and awareness are crucial to achieve reduction targets
The built environment has the capability to implement low carbon options to influence most of our lifestyle choices, but that would not be enough. We also need to efficiently communicate which the most sensible choices are - so that building users can take informed decisions - and then find strategies to encourage them to take the least emitting ones.
Lifestyle carbon profiles were defined by respondees answering a series of 10 multiple choice questions, the calculation table for which you will see on the next page.
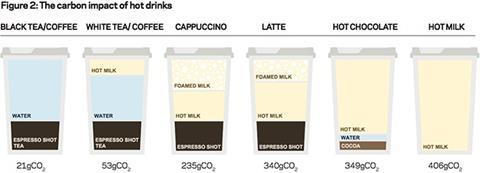
03 / Lifestyle choices impact: hot drinks
A common latte emits 16 times more carbon than a black coffee. The ingredient responsible for this huge difference is milk. You may have thought that transportation would cause a higher impact because cocoa, tea and coffee are not locally sourced in the UK. However, products with long lives are normally shipped by boat, which is one of the least emitting means of transport.
On the other hand, milk comes from one of the least carbon-friendly livestock. Cows are big animals and feeding them to adult stage emits a large amount of carbon. They are ruminants (they chew the cud) and their digestive system also emits large quantities of methane to the atmosphere, which has a high environmental impact that doubles the carbon footprint of milk. Therefore, the more milk your drink has, the higher your carbon emissions will be.
Frequency amplifies the impact of lifestyle choices and their carbon-saving potential. The carbon difference between hot drinks options is relatively big, but the emissions of any of them compared with other sectors - such as building construction or cooling loads - are tiny. However, if you change your habits today, the impact in the long term tells a completely different story. How many coffees do you have every day at work? Two? That is 10 coffees per week on average, or around 500 cups per year. How many years do you need to work before you reach your well-deserved retirement day? Let’s assume 35 years. That is 17,500 coffees. If you had shifted your latte to a white coffee when you started your career, you could have saved around 5,000kg of CO2e by your retirement day, which is the same amount of carbon that your work laptop will have emitted in the same time.
Figure 3: Lifestyle carbon profile: calculation table
Calculate your lifestyle carbon footprint using this table and compare it with figure 4 to find out where you stand compared with the average Londoner. For a full questionnaire please refer to http://sturgiscarbonprofiling.com/
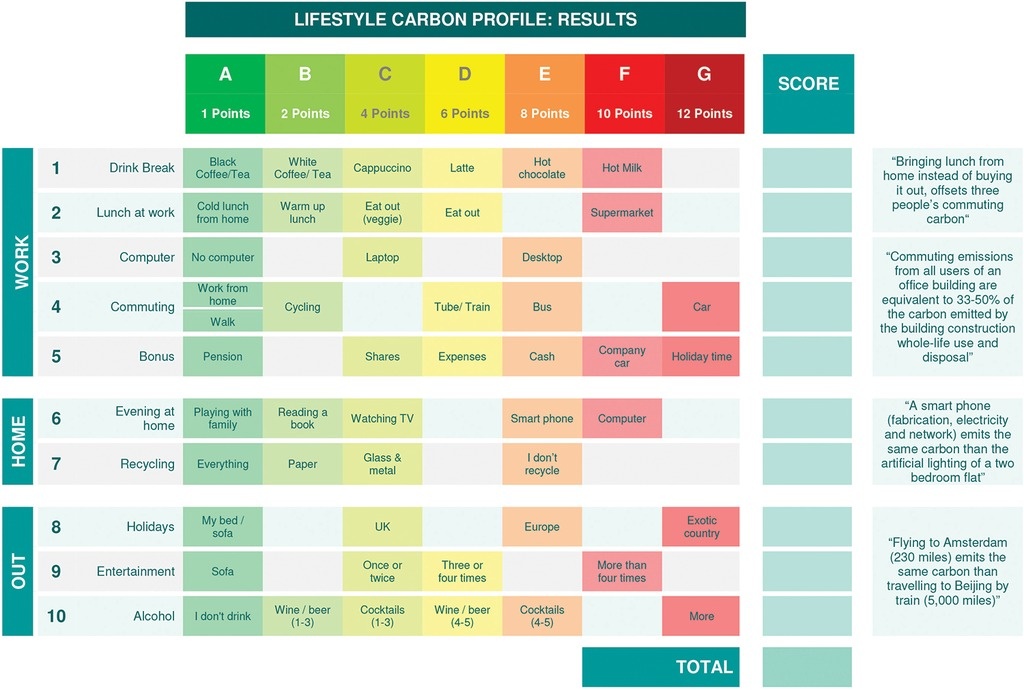
Click on the image above or here to see a large version >>
04 / The challenges of lifestyle carbon reduction
Undertaking a holistic view of our carbon footprints will help us to re-examine how to reduce people’s carbon emissions.
One of the main challenges in this area is how to clearly communicate results. Carbon emission figures are too abstract, and without suitable references they are not relevant to most of us. For example, a desktop computer emits 51g of CO2 more in one hour than a laptop. But how bad is that? What does 51g of carbon look like?
To help deal with this we found that talking in terms of real things, such as trees or land areas, makes carbon emissions impacts more meaningful to people: using a laptop instead of a desktop at your workplace offsets the carbon absorbed by 10 trees.
On top of this, we can then start to build in the carbon emitted from the manufacture of the computer, which would account for a further 10-30 trees. We found that using these types of direct messages helps to deliver greater behavioural changes than just dealing in numeric terms.
Another challenge we found was helping consumers to differentiate between carbon-intensive and low-carbon choices or activities. Sometimes, labels give hints about the energy that equipment will consume. However, those labels do not tell the big picture on emissions from all life stages and they are only available in very few sectors, such as energy bulbs or kitchen equipment. If we want to encourage everyone to take the right decisions, we either need to figure out a way to communicate whole-life carbon intensity - for example a labelling system similar to the calorific content of food - or perhaps only options with low carbon intensivity should be made available.
This poses the question as to how far regulations should reach. Lifestyle choices are very personal and setting statutory limits upon them will of course start huge debates on individual freedom, and there will always be sectors that will oppose plans. For example, taxes on most emitting cars are never welcomed by the automobile industry. Industries and individuals will not welcome limitations in their capability to choose.
Perhaps the key to dealing with this is education and revealing to people the associated benefits that come about form low-carbon lifestyles, such as health and wellbeing.
This brings us back to knowledge and awareness. The solution is not to cut the population’s purchasing power, or directly to legislate choice, but to make the population perceive environmental consumption as an aspirational personal and collective good.
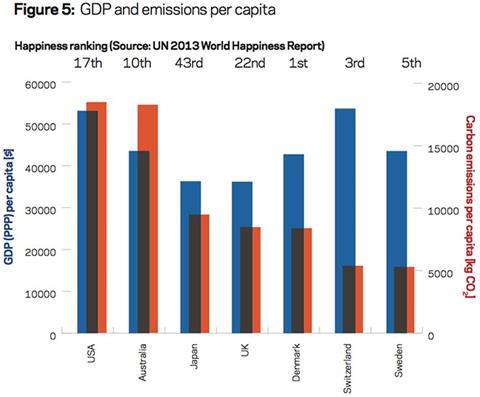
To begin to convey this, it is useful to rank countries by GDP and carbon emissions per capita. What becomes clear is that being a developed nation does not have to automatically infer high carbon-intensive lifestyles. In fact, if we examine personal happiness indexes it seems that developed nations that are less carbon-intensive also tend to be the ones that have higher levels of social cohesion and are places that people generally prefer to live.
With many countries in the world, such as China and India, rapidly gaining in purchasing power, the question about how to deal with climate change may be much more about the aspire to create with their new found wealth and purchasing power.
Will they follow the US example of high consumption and waste with poor social structures, or will they see a brighter future in the examples shown by some of the Nordic counties, which have strong social structures, and low carbon lifestyles?
05 / Resolutions
If we want to succeed in involving people in reducing the carbon footprint associated with all our lifestyles, here are a few suggestions to begin with:
- Communicate clearly where carbon impacts exist and display these impacts in terms that people can relate to
- Reveal the whole life picture so impacts down the line are not hidden and unintended consequences don’t occur
- Promote sustainable consumerism as an aspirational good with benefits to health, society and personal wellbeing
The list below includes some simple resolutions that you can take to achieve 10% reduction in your carbon footprint. This would save the equivalent of one-third of the carbon emitted by your home, without the need for any solar panels or loft insulation. Most of these suggestions are personal, but any organization can also reduce their carbon footprint by around 15-20% without people noticing any impact on their everyday activities by focusing purely on the supply chain and procurement
FIVE ACTIONS TO CUT 10%
1. Home-made meat-free weekday lunch:
Cutting out meat one day a week can generate a relatively large impact. It also opens the door to lunch options that will not need ways of reheating at work - saving even more carbon. The initiative is perfect to engage a group of co-workers or to promote the routine through the whole workplace. If successful, in the second year you could aim to add another day, as long as the risk of dropping out is low. The aim is to feel healthier and fitter and save carbon on the way.
The helpful push: By engaging in a meat free lunch once a week, in 20 years you could compensate the carbon emitted in the manufacture of 5,300 bricks, or all the walls in a two-bedroom flat.
2. Go sober for a month:
This one is not that easy at first, but it gets better when you figure out what to order in your local pub and it is also limited to a precise timeframe. The extra incentives are getting your Sunday mornings back, and you could donate the money saved to a charity.
The helpful push: Your first alcohol-free month will compensate the carbon emitted by your work laptop during the whole of next year.
3. Cycle to work three days per week:
www.gov.uk/government/publications/cycle-to-work-scheme-implementation-guidance
Hopping on a bike to get to work has a huge carbon saving potential, and of course countless other benefits: you will feel much healthier, you will forget about traffic jams, waiting for buses, packed carriages and fuel prices, and you will also be able to predict how long your commuting trip will take. The cycle-to-work scheme from the government will also allow you to enjoy a brand new bike with a generous tax deduction.
The helpful push: If you cycle to work three days a week, you will compensate the carbon consumed by lighting a two-bedroom flat.
4. Change from plane to train for one trip to Europe
Flying is by far the most polluting means of transport. A single long-haul flight can triple your annual holiday emissions. Frequent flights will multiply emissions: a UK company that needs to fly to New York once a month will have easily emitted in 30 years as much carbon as was used to construct the building it is based in. Video conferences are recommended in these cases. For closer destinations, the European high-speed rail network makes many continental cities easily accessible.
The helpful push: One return flight to Paris accounts for 2% of an average Londoner’s annual carbon emissions. A return flight to New York accounts for 16%.
5. Ditch screens in the evenings
Most of us spend a lot of time in the evenings watching TV series or on social media, but from time to time we also wish we could use that time more productively. The key point to successfully implement this strategy is to find suitable less carbon intensive activities. Did you play a music instrument when you were young(er)? Try playing around three days a week. Were you an avid comic and graphic novels reader? Maybe you should visit the loft and retrieve your old treasure boxes. Learn French, play board games with your kids, socialise with your flatmates… the options are endless.
The helpful push: If the average household stops using mobile phones and computers in the evenings, up to 20% of their heating carbon emissions could be compensated.
ACKNOWLEDGEMENTS
We would like to thank Gareth Roberts and Maiia Guermanova for their assistance and advice in preparing this article.
REFERENCES
Many of the examples in this article have been calculated using information extracted from “How Bad Are Bananas? The Carbon Footprint of Everything” by Mike Berners-Lee - a funny and surprising book that we strongly recommend.


No comments yet