


Although Q1 2014 saw output and price levels taper off, the overall direction of the industry remains encouraging, especially considering its supply and skills constraints
01/ Executive summary
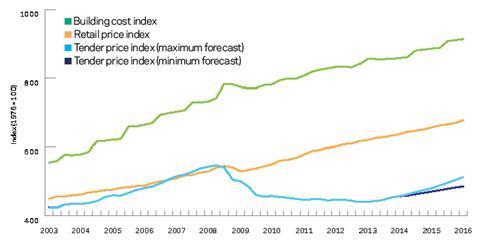
Tender price index ▲
Prices measured as an average across sectors increased only marginally in Q1 2014 as the rate of change slowed. Annual forecasts for 2014 and 2015 remain unchanged at
4.1 and 4.5% respectively.
Building cost index ▲
Strong demand for key materials and some trades has maintained the rate of annual growth for these items. The rate of annual increase in the overall index slowed marginally in Q1 2014.
Retail prices index ▼
Year-on-year change remained broadly constant at 2.7% in Q1 2014. Similar increases are forecast through 2014.
02/ Trends and forecasts
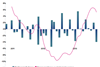
Following a 20% fall in tender prices from Q2 2008 to Q4 2012, price levels continue to recover lost ground. In the first quarter of 2014, tender prices were 4.1% higher than the low point at the end of 2012. But it will be mid-way through 2017 before tender prices reach 2008 levels, based on current forecast trends of about 4.5% a year.
Although increased price levels are being sought by contractors, Aecom research shows that competitive pricing, and more specifically unit rates, are still available. As the market finds a new level, variability in tender spreads will continue and normalisation in market pricing will be seen once tender spreads narrow.
The rate of change in tender price inflation eased in Q1 2014, after four successive quarters of notable increases. The quarterly increase in Aecom’s Tender Price Index (measuring average tender price movements in Greater London across all sectors) of 0.66% indicates some dissonance with elevated expectations of brisk rises in market pricing. For example, competitive supply and install rates for reinforcement between £950 and £1,050/tonne, reinforced concrete at £135-£155/m3, steelwork universal sections at £1,400-£1,500/tonne and steelwork hollow sections at £1,650-£1,850/tonne, recently tendered on London schemes, are broadly similar, or only marginally higher in some cases, to those tendered in mid-2013.
Preliminaries continue to edge upwards, reflecting improved constructor views and a higher cost base for supervisory and management staff. Further, a transition to appropriate risk allocation is occurring within priced tenders, rather than risk transfer without associated or adequate cost allowances. Risk is likely to be fully priced now, rather than used to shape an overall tender price. Despite this, margin pressure will continue over the near to medium-term.
Aecom analysis of tendered data across UK’s regions shows that similar pricing trends and decisions are becoming embedded, although uniformity and synchronicity in price increases is not yet evident. Variation in sector activity also indicates that broad-based workload improvements are not fully established either.
The evolving transition in market pricing is underlined by the fact that some major contractors are still feeling a chill with respect to revenue. Construction businesses are often cited as the source of persistent challenges when compared across their portfolio of construction industry businesses. Variable market conditions, lingering investor uncertainty and selectivity in procurement are all factors.
Annual tender price inflation forecasts across all sectors from Q1 2014 to Q1 2015 are 3 to 5%.
The base of this range has risen in response to improved confidence and skills shortages. Typical price inflation of 3.9% is therefore expected on an annual basis in 2014 across sectors in Greater London, while 2015 sees annual price inflation increase to 4.5%. The range of annual tender price inflation from Q1 2015 to Q1 2016 is 3.5 to 6.5%.
Business confidence for manufacturing and services, recorded in a quarterly poll of 7,500 firms by the British Chambers of Commerce (BCC), is stronger than long-term averages. Access to finance was cited as a key issue that continues to hinder investment. BCC notes, “despite this progress, the recovery is not yet secure”. Economic activity remains steady “but UK growth is still unduly reliant on consumer spending, driven by a buoyant housing market and a declining savings ratio”.
The International Monetary Fund (IMF) expects the UK to have the fastest growing economy in the G7 nations at 2.9% in 2014. The Office for National Statistics (ONS) also stresses the importance of GDP as a metric for measuring the state of the economy but highlighted its long-known weaknesses as a measure of economic welfare or well-being. The ONS stated that the UK’s economic performance in recent years looked different depending on which measures were used. Still, UK industrial output in February grew at its fastest pace in eight months. ONS data shows industrial production rose by 0.9% from January to February, and manufacturing expanding by 1%.
Construction activity in part is linked to “healthy” investment - business investment that adds to the productive capacity of the UK, as opposed to that of the consumer-led variety which is underpinned by debt, remortgaging and lower savings ratios. The Office for Budget Responsibility’s (OBR) forecasts for the UK economy to 2018 are predicated on substantial year-on-year increases in business investment. What appears exceptional is the sharp reversal of an established trend of real business investment as a share of GDP. Business investment growth averaging 8.4% a year is now forecast between 2014 and 2018.
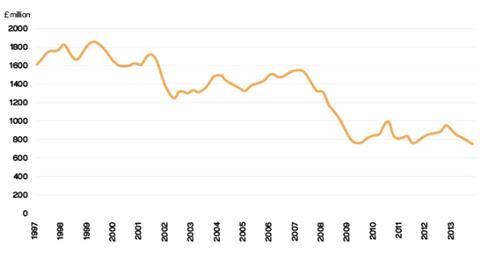
Whilst this trend reversal is remarkable, it is in fact essential to the sustainability of any recovery. It is critical that a handover occurs from a consumer-led rebound to an economic recovery driven by business investment. The impacts for construction are direct and tangible. A 50% collapse in the industrial sector’s construction output since early 2007 offers a recent example and paints a stark picture. Nevertheless, in support of the OBR’s forecasts, Deloitte’s quarterly survey of finance directors suggests that UK companies plan to increase capital spending and hiring in the next 12 months to its highest level for three and a half years.
A / AECOM INDEX SERIES (PREVIOUSLY DAVIS LANGDON)
03/ Focus: Regions
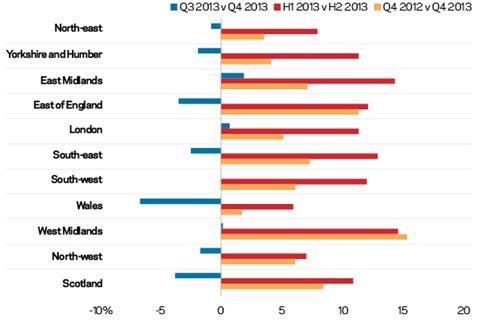
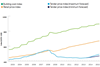
Activity and sentiment indicators across the UK paint a mixed picture. Northern England, along with the South-west and eastern regions, indicate improving times, whereas other areas continue to experience lagging output. Broader trends point to good improvements in workload and output, despite some fall away of the readings towards the end of Q4 2013 and into Q1 2014.
Output data from the ONS supports activity surveys. All regions show healthy increases in all workload when comparing H2 2013 with H1 2013. But quarter-on-quarter movements underscore the fitful nature of workload and output, with only London and the East Midlands recording tangible growth in Q4 2013 versus the previous quarter. More importantly, improvements to new work output are evident when quarterly data is compared to its corresponding period one year prior.
Save for Scotland, repair and maintenance (R&M) work posted good gains in recorded output in H2 2013 versus the first half of the year. Could this rebound in activity result from the need for essential work now required to address under-investment and repair fuelled by severe reductions in public sector R&M? Tighter purse strings have to be loosened once the fabric of built assets begins to deteriorate. Or perhaps increased R&M expenditure is timed to coincide with an approaching election? Private sector repair and maintenance also improved well in the second half of 2013, which correlates with known rises in consumer expenditure and declining household savings ratios.
Housebuilding clearly leads the way in propelling the rebound. In four regions, private house building output has doubled by value.
Positive pay trends are now evident across most of the English regions. Despite a geographic differential which has long existed - with the South-east at the head of the list - all English regions are seeing increases in average earnings such that this regional pay differential is not widening materially. Underlying trends indicate that some of the brisk wage increases experienced in Q3 2013 eased in recent months, perhaps because of stabilising workload and greater visibility of future work pipelines.
The public sector is still a dominant source of construction activity in the regions, although a blend of cross-sector work is represented in current workload and order books.
Selective tendering emerges as a common theme amongst contractors in the regions. Stated aims of pursuing repeat business and a focus on alignment with clients who value quality are regularly cited. High levels of secured work for 2014, limited experience of the projects on offer and skills limitations because of churn or decisions made during the recession are all driving the selective approach to tendering.
Supply chain issues add to the management complexity of selecting and delivering projects. Allocations of brick supplies, increasing lead times for deliveries and proximity to suppliers creates additional concerns within a constricted industry. Client and contractor attention has turned to imports of materials and labour to manage these issues. Flow through effects for design then follow, with a possible need to avoid incorporating large elements of work where regional skills and materials shortages exist. Incremental and marginal cost premiums are the likely commercial outcome to attract resource back to home regions, which are committed elsewhere in the country.
Contractors’ forecasts for tender price inflation across UK regions range 3-7%, but, on average, 5% a year emerges as the common expected increase.
As the industry’s regions transition to the next phase with higher workload, there is a recognition that many operational and management issues exist on the way out of recession. Supply chain issues are magnified at a regional level where the available skill pool might be smaller or more limited. Additionally, margins are expected to remain squeezed for the next 12-24 months, particularly as staff costs increase after a remaining static for a number of years. The lag between immediate cost increases and the benefit of higher output prices until later in the project cycle compounds the margin equation.
B / REGIONAL CONSTRUCTION OUTPUT - ALL WORK
04/ Activity indicators
The seasonally adjusted estimate of construction output in February 2014 grew 2.8% year-on year.
But this represented a fall of 2.8% when compared month-on-month to January 2014. Monthly volatility in the data continues. Although severe weather in
Q1 2014 affected construction output, the figures are seasonally adjusted and the adverse cannot explain all of the monthly fall in output. A 2.6% fall in new work in February was broad based across sectors - four out of six - with only public new housing and private industrial activity seeing a pick-up. Repair work subsequent to the flooding and storms is yet to be included in the ONS data. It is expected that this component of overall output will record decent figures in the next ONS releases.
The latest ONS data release highlights the growing divergence between output in the public and private sectors. Year-on-year changes show that private sector output rose by 1.0%; but public sector output fell by 6.0% over the same period. Longer-term trends indicate a pronounced and growing divergence between the two sectors. Total construction output funded by public sector clients has fallen 24.3% since March 2011. This figure is dominated by a substantial fall of 36.6% in other new work - £760m of output in this classification is the lowest volume recorded. Housing continues as the sector that accounts for most of the increase in the private sector’s output, up 15.3% since January 2013.
New orders for construction in Q4 2013 are estimated to be 1.5% higher than Q3 2014 due to a 5.2% (£200m) increase in orders for new housing. All other work fell 0.4% over the same period, largely from a 22% decrease in orders for infrastructure. Nevertheless, longer-term comparisons show the gradually improving picture for the construction industry. Year-on-year increases in new orders were 4% higher than the same period in 2012.
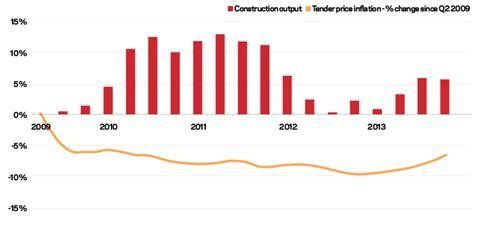
C / UK CONSRUCTION OUTPUT - ALL WORK % CHANGE SINCE Q2 2009
D / UK CONSTRUCTION OUTPUT - PRIVATE INDUSTRIAL SECTOR
05/ Building cost index
Aecom’s building cost index rose 1.8% year-on-year in the fourth quarter of 2013. Once more, the rate of change slowed when compared to the preceding quarter. But continuing high demand for materials highlights the variability in costs and demand emanating from construction sectors. Concerns over output and potential capacity of UK producers, principally bricks and blocks, is leading some to explore increased levels of imported materials. The rapid increase in housebuilding has led to a scramble for supplies and brick allocations are being used in certain instances to manage supply issues.
Despite some headlines in respect of bricklayers, typical day rates range between £140 to £170/day. Bonus payments based on output targets can improve these figures. Labour rates are responding to higher demand and supply constraints in particular sectors across the regions. Day rates for joiners have seen recent increases too, and range between £140 and £180/day. Should construction workload expand to the levels forecast over the next few years, the skills crunch is likely to become more apparent, without a commensurate increase in supply. Increases in imported labour is an obvious way to address concerns around runaway wage inflation.
Commodity prices slipped again in Q1 2014, with energy prices down by 1% according to the World Bank. Metals and minerals indices also fell by approximately 3% on the month in March. Iron ore dropped by 7% month-on-month, most likely in response to waning Chinese demand and a marginally slower economy.
The ONS’s Economic Review April 2014 makes specific reference to construction in its discussion on average real hourly wages. For the economy as a whole, average real hourly wages were 7.6% lower than similar average earnings in 2008. Mentioning the substantial variations between industries, the ONS details average real weekly pay across four different industries relative to 2008. The finance and business services industries suffered the least with just a 4.2% fall in average real hourly pay. Manufacturing and services fell by 5.6 and 6.9% respectively. But construction was the laggard with a drop of 13.4% in its average real hourly pay in Q4 2013.
A recent two-year pay deal agreed by the Building and Allied Trades Joint Industrial Council (BATJIC) sees standard wages rising by an average of 2.5% from 30th June. A further set of rises averaging 3% come into effect from 29th June 2015. Annual holiday entitlements also increase by one day from 29th June 2015. Apprentices and trainees are set to receive 3% increases in hourly wages from June 2014 and June 2015.


No comments yet