


Leading indicators highlight renewed optimism. But don’t break open the champagne just yet …
Executive summary
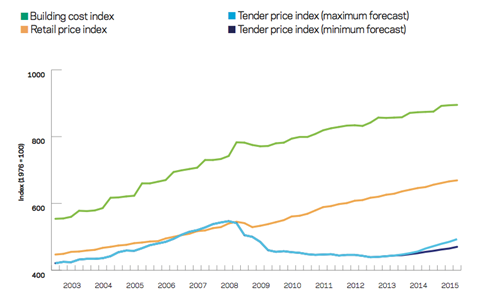
Tender price index ▲
Prices edged up in the third quarter as a result of emerging increases in output, new orders and renewed optimism. Price pressure will remain, with some sectors expected to see increases above prevailing inflation.
Building cost index ▲
Annual growth of 2.6% reflects the continuing trend of steady increases in materials costs. Notable demand for certain skills and trades is creating stress within the supply chain.
Retail prices index ▲
Retail prices advanced by 0.5% in the third quarter. General inflation rates remain elevated and are expected to continue along the same path.
Trends and forecasts
Recent media coverage has heralded rising confidence on the back of recent economic data. This improving sentiment is underlined by the further shift of two quarters of GDP growth and purchasing managers’ indices (PMI) into positive territory. A recent CBI survey reported that more than half of respondents were optimistic about the outlook for their business. Financial organisations feel the most sanguine since 1996 and plan to hire at the fastest pace in 17 years. Similar views expressed by construction firms also underline optimism for employment, with job creation at its quickest for six years. Economic forecasts for the UK have been revised upwards, most recently by the International Monetary Fund (IMF), though consumer price inflation remains stubbornly above its target level.
But improved sentiment is leading to a changing outlook on construction output - at least for the time being - and regular forecasters have revised predictions. Although 2013 remains largely unchanged with nominal growth, it is in 2014 and 2015 where output forecasts have been materially altered.
Price trends may be in for a bumpy period if the supply chain can exert influence in the commercial process
Nascent increases in current workload are forecast to create momentum through the short to medium-term, with the Construction Products Association (CPA) forecasting growth of over 2.5% in 2014 and 4.6% in 2015.
Aecom’s tender price index, which measures average tender price movement for competitively tendered projects in Greater London, continued to edge up in the third quarter of 2013. While this underscores an improving price environment for contractors in this region, the same story may not yet be replicable across the UK, or across sectors. Generally, price levels in the regions remain unchanged, although there are nuances depending on location and sector.
Price competition has been maintained by the notably low levels of output posted in the last 12 months. Any step-up in activity and demand for industry services should eventually encourage a broader-based increase in prices. An inflection point may be approaching more generally for pricing - at least if momentum is maintained in new orders. In a further sign of changing outlook, Aecom’s market factor index is slowly approaching a positive benchmark, after spending the last 22 quarters firmly in negative territory.
Cost pressure has not abated as input costs stay elevated and, to date, tender prices remain compressed. In the absence of major adverse events, input costs are likely to continue their steady ascent. Although materials inflation has been the primary driver of cost increases, labour costs are now expected to inflict further pressure in certain sectors.
All things remaining equal, a quickening of rises in some input costs may quickly feed through into output prices, given existing capacity constraints. Main contractors anticipate margin increases from the supply chain imminently, in turn squeezing their own margins. Consequently, price trends may be in for a bumpy period if the supply chain can exert influence in the commercial process. It should not therefore come as a surprise if there are larger spreads on tender returns in the near-term. Tender price inflation is expected to be higher than prevailing rates in sectors where there is a larger requirement for domestic trades. Further, should the trajectory of new construction work be maintained, construction prices are likely to rise ahead of general inflation by 2015. Annual tender price inflation for the year ending Q3 2014 is forecast at 2-5%; and 3-6% for the year ending Q3 2015 in London, as the supply chain seeks to recover some of the ground lost over previous years.
Indirect or preliminaries costs have been heavily trimmed by contractors during the downturn, with consequent effects on any commercial offer. History has shown that this is one of the first areas to show an increase once the market starts to pick up after a period of decline and stagnation. As activity increases in the near-term, resourcing and skills are now proving to be an area of emerging concern - both recruitment and retention of staff. Preliminaries costs are therefore expected to increase in the next phase of the industry’s transition, should current workload trends continue. Similarly, tendering opportunities will be declined where there is a risk that the project cannot be appropriately resourced.
Focus: rebound or recovery?
After five years in the doldrums, industry surveys and PMIs point to renewed optimism throughout the industry. Not since July 2007 has it returned higher prints on these leading indicators. Growth forecasts have been revised upwards for 2013 and 2014: for example, the CBI forecasts growth of 1.3% in 2013, and a further acceleration in 2014 of 2.3% GDP growth.
Yet two positive economic readings do not make a trend. Four of the last 11 quarters have seen negative GDP growth. Sentiment surveys do not always result in definitive changes on the ground, and 2011 and 2012 both heralded a change in mood only to be promptly extinguished by external events. Put more exactly, the economy has stopped shrinking, which is subtly different to a much-vaunted recovery. Nevertheless, it is churlish to deny recent quarter-on-quarter GDP has been encouraging, though improved economic activity from a low base will understandably generate positive headlines.
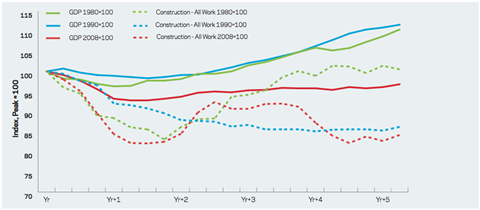
Historical trends underline the direct links between sustained growth of the UK economy and that of UK construction. For the UK economy to improve, construction also has to, or should, return to health. The question is whether the former leads to the latter, or vice versa. Perhaps recognising the link, the government has chosen to spur the housing sector and housing supply through market intervention. Necessity has also meant that supply must be increased given the distinctly low levels of present housing completions. A by-product of the intended illusion of increased personal wealth is to propel consumer expenditure, which in turn offers some indicators for businesses to make future investment decisions.
What is clear is that an industry heavily shaken by the recession is desperate for good news
Assertions that balanced growth is in play are less clear. Improving economic data has part of its genesis in consumer spending. Banking data shows that savings rates have reversed and credit card lending rates are accelerating. Mortgage lending, although increasing, is still at comparatively low levels. Private non-financial companies’ lending growth rates remain negative. Short-term cyclicality should not be overlooked as a reason for the better data in recent quarters. Restocking cycles after a period of destocking, better weather enabling construction activity and consumer expenditure are likely to have provided the economy with a boost in Q2.
External risks in developed and developing markets remain or are unresolved, and market volatility is unlikely to dissipate in the near term. The UK’s economic outlook is linked to confidence and the cost of lending, among other things. Market interest rates are often derived from benchmarks such as the yield on 10-year government bonds. The Bank of England maintains that interest rates will remain low for some time yet. But the market seemingly disbelieves the Bank, as the yield on 10-year UK gilts doubled in six months earlier in the year.
It was suggested that rising interest rates signal confidence in an economic rebound. This may be true; however, positive links between UK gilt yields and confidence in the economy are not always drawn. Much talk was made of increasing bond yields being an indication of market mistrust of the UK’s economy. Benchmark lending rates reflect market views on the cost of borrowing and the impact of this on construction may have consequences further down the line.
It could be safer to call this a rebound for the construction industry rather than a sustained recovery
What is clear is that an industry heavily shaken by the recession is desperate for good news. Recent changes in sentiment and new orders are reviving optimism. But burgeoning workload must be set in context: new orders and output are advancing from a low - perhaps the lowest ever - base. The economy is regularly compared with its pre-crash peak. On this metric, it is still 3% smaller. The reality, however, is that output in the years leading up to the downturn was not sustainable. Comparisons are therefore unhealthy and perhaps not reflective of the current situation. Distant talk of V or W-shaped recoveries has given way to a more L-shaped postscript.
Any recovery should avoid the unfavourable aspects of the years leading up to the financial crisis. Specifically, the UK needs an alignment of the strategic goals of its productive capacity with a visible pipeline of construction output. This enables the industry to minimise cycles of boom and bust, support investment and ensure sustained contributions to UK GDP. Cyclical economic issues are well documented in their effects on the construction industry and its subsequent impairment. But destocking and restocking cycles could remain shorter and therefore become more frequent in the general economic context.
Supply chain constraints have manifested themselves very quickly on the strength of emerging increases in workload, which is of some concern. The knock-on effects elsewhere in the industry may yet prove to be an interesting story in itself. And incremental rises in orders and output could alert potential new entrants to the UK construction industry as a source of revenue, adding to price competition among contractors once more.
Until stable, continuing and robust quarterly GDP growth is evident and momentum across sectors is clear, it could be safer to call this a rebound for the construction industry rather than a sustained recovery.
Activity Indicators
Construction output
Office for National Statistics (ONS) construction new orders and output figures from Q2 2013 detailed notable increases, in both yearly and quarterly growth metrics. Quarterly growth rates for new work rose by 3.2% in Q2 2013, while seasonally adjusted total output grew by 2% year-on-year. More recent figures for Q3 2013 underscore the broader trend of volatility in output data and the differing fortunes across sectors.
Looking beyond the headline figures, and negative growth trends still in some sectors, housing has taken the headlines as housebuilders respond to government policies. New orders for infrastructure also returned healthy increases in Q2 2013 as electricity, wind and solar projects contributed to the growth figures.
It is important to recognise the backdrop and context of the new work and current output increases, as the ONS baldly reminds us that the downturn had a more pronounced effect on the production and construction sectors than others comprising the UK economy. Furthermore, the industry experienced its own double-dip despite the UK economy having its much discussed double-dip narrowly revised away. Broadly, output levels still remain below those of 2010 and 2011. Similarly, the total value of new construction output is marginally above the post-crash nadir of 2009 (current prices). Fundamentally, construction output as a proportion of GDP is at its lowest for over 50 years.
Orders for new construction
Although there was a reported 32.8% year-on-year increase in the value of new orders for all new work in Q2 2013, the comparator in 2012 was the lowest value in the index series since 2005. Headlines do not therefore tell the full story. Moving averages remove the effect of monthly fluctuations in data, and they now indicate a more gradual increase in new orders from a floor in Q3 2012. Adverse weather over the winter is likely to have affected output earlier in the year and Q2 2013 figures will include work deferred from Q1.
The downturn had a more pronounced effect on the production and construction sectors
Markit/CIPS UK Construction PMI
Markit’s UK construction purchasing managers’ index for September posted a slightly lower figure than August’s print, which had been a six-year high. Values greater than 50 indicate output expansion, and September’s figure was the fifth consecutive month where this occurred. Firm improvements in sentiment were recorded across the three PMI sub-sectors of residential construction, commercial and civil engineering activity.
The Barbour ABI index of new build contract awards to August 2013 again underlines the mixed fortunes of sector activity. Moving average trends show a gradual pick-up in the index to the middle of 2013, but recent monthly prints have tapered off.
CPA’s Construction Trade Survey highlights further nuancing of workload with small and medium-sized firms continuing to report workload increases, yet larger firms reporting a fall in orders. Nor is it a broad-based geographic improvement: regional variations exist in workload across sectors.
Lead times and sector capacity are beginning to experience some movement after many months of being static. Some sectors report an increase in enquiries for early trade activities as up-ticks in workload begin to feed into the market.
Building cost index
Aecom’s building cost index rose 2.6% year-on-year in Q2 2013. Provisional figures for Q3 2013 indicate that the index increased by 3% compared with the same quarter in 2012. Broadly, materials suppliers expect sales to rise appreciably in the next 12 months, although this view is not shared across the board.
Much will depend on sector activity and consequent demand for materials. Where sectors are running hotter than others, price rises are likely to be experienced as demand intensifies for sector-specific materials. Bulk-buying and stockpiling of materials to secure future supply could also exacerbate price spikes. Structural steel prices have been pushed higher recently on the back of two £25 per tonne increases announced by manufacturers. This reverses a general trend of falling steel prices through 2013. Commodity prices rallied in Q3 2013 after a trend of price falls established earlier in the year.
Materials
Building materials indices published by the Department for Business, Innovation and Skills also continued to rise steadily through 2013. Year-on-year increases to August were approximately 1%.
The pace of price changes is becoming more pronounced in certain materials classes as demand spikes reflect variations in the activity of sectors within the industry. For example, stronger price growth in bricks, blocks and timber reflect the burgeoning increases in workload of the housing sector.
Labour
Labour rates will come under pressure, as pay awards during 2013 have been below consumer price inflation. Workload increases are adding to the squeeze, and operatives are beginning to feel increasingly bullish in their efforts to secure pay awards.
Bricklayers, joiners and plasterers are experiencing significant increases in demand, which is generating price tension. Recent anecdotal evidence suggests that labour resources have moved sites quickly, simply for the offer of higher remuneration.
Aecom’s building cost index for materials and labour is forecast to increase by approximately 2% in the year to Q3 2014, and by 2.5% year-on-year to Q3 2015.
In the absence of major adverse events, prices are not expected to be unduly influenced by external pressures, and domestic issues are likely to determine the pace of change in this area.

No comments yet