


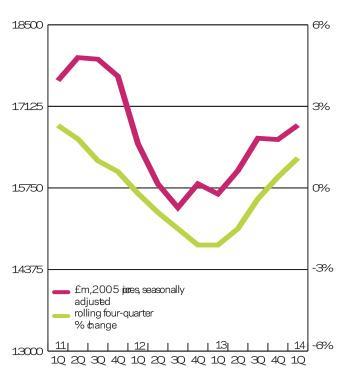
Experian Economics shows that construction activity has seen its fourth consecutive quarter of growth, reaching an overall figure that is now at its highest point since the final quarter of 2011
01 / Overview
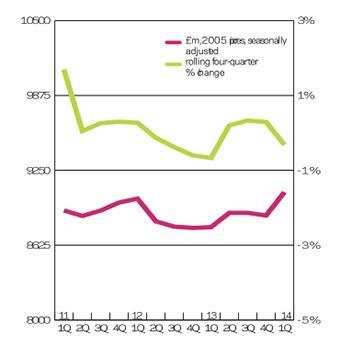
Total construction activity reached £29bn in the first quarter of 2014, 1.5% higher than the previous three months, and the fourth successive quarter of growth. The overall figure is now at its highest level since the final quarter of 2011. Repair and maintenance (R&M) saw a moderate uptick of 1%, taking it to £11.1bn.
UK GDP growth in Q1 of 2014 was in line with expectations at 0.8% quarter-on-quarter. This outcome took the increase in GDP to a robust 3.1% compared with the same quarter a year ago, reducing the gap from the pre-recession peak (Q1 2008) to 0.6%.
Private housing was the best performing sector in 2013, increasing 9% on an annual basis to £17.1bn, its highest figure since 2008. Much of the upswing can be attributed to the Help to Buy scheme, which has stimulated demand within the sector, a trend expected to continue as long as the terms of the incentive remain unchanged. The upswing was also apparent on a quarterly basis, with successive growth in each quarter of 2013; the momentum continued in the first three months of this year.
The outlook for the public housing sector was similarly positive, picking up 7.4% annually to £4.5bn, albeit remaining someway off its medium term average. Like private housing, quarterly figures rose sharply in each period of last year, with the trend carrying on in the first three months of this year, reaching £1.4bn. The figure is 35% higher than its corresponding value for 2013. The four-quarter moving total told a similar story, rising for the fourth consecutive period. Public housing is expected to continue growing steadily in line with general economic recovery, coupled with an easing of post-recession budgetary constraints.
The same cannot be said for all the public sectors, as public non-residential construction endured further declines last year, slipping for the fourth consecutive year with a 10% dip to £9.4bn. However, we may be coming to the end of the sector’s decline if quarterly figures are anything to go by. The rate of decline eased in each quarter of 2013 and the first one of this year, where activity effectively flattened out on a quarterly basis, it was also only 1% below its value for the previous year. It would be safe to suggest that the sector is finally at its post BSF/recession nadir.
It was also a sluggish year for industrial construction, slipping 8% to £3.3bn. Nevertheless, Q1 2014 represented a return to growth with a 10% uptick. The sector is expected to do better over the forecast period, given its close relation to positive economic indicators. Increased export demand should help UK manufacturing, moving in line with demand for industrial units, coupled with the prevalence of e-commerce and its related distribution requirements. Large-scale projects such as the London Gateway development should help support positive sector projections. Site activity has been underwhelming so far, but take-up is expected to increase sharply in the medium term.
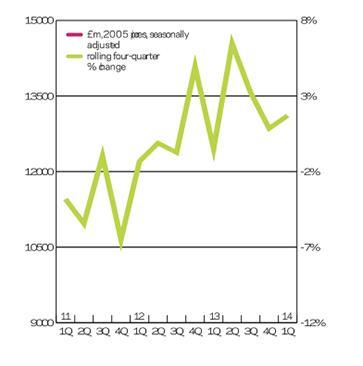
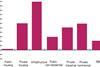
Total new work orders fell 6% to £11.5bn in the first three months of this year, though they were 8% above value for the same period of the previous year. Performance across new work sectors in the first quarter of this year was mixed. Private housing managed further growth ticking up 3% quarterly and 26% annually. Public non-residential construction also managed moderate growth, up on a quarterly and annual basis, although figures remain significantly below their long term average. Somewhat unexpectedly, infrastructure orders fell on both accounts; although orders tend to be lumpy given how one or two major projects can skew the overall figure.
02 / New work output
03 / R&M Output
04 / New work orders
05 / 2014-16 Forecast
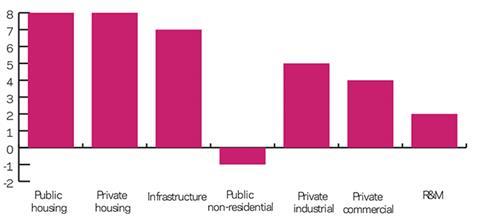
Growth is expected in all the new work sectors over the forecast period with the exception of public non-residential construction which should, at the very least, flatten out. Public and private housing are set for the strongest annual average growth at 8% a piece, followed by infrastructure at 7%. Moderate growth is expected for the industrial and commercial sectors, at 5% and 4% respectively.
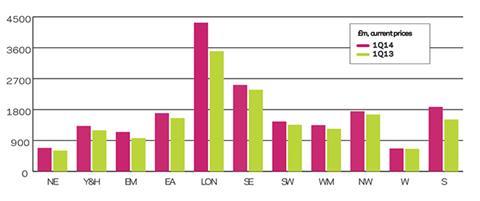
06 / Regional new work output
Output in every region and devolved nations was higher in the first quarter of this year than it was in the same period of 2013. London, Scotland, East Anglia and the East Midlands all experience notable increases.
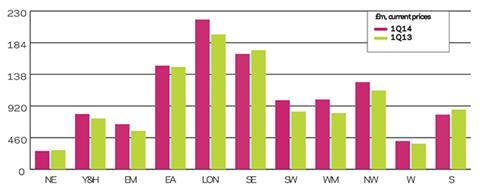
07 / Regional R&M output
The repair and maintenance (R&M) sector saw growth in eight out of 11 regions and devolved nations. On an annual basis the East and West Midlands saw the strongest increases of 17% and 24% respectively. The North-east, Scotland and the South-east all saw corresponding declines of 5%, 9% and 3%.
08 / Regional new work orders
New work orders in the first three months of 2014 picked up in the majority of regions and devolved nations (six out of 11). The North-east, East Midlands, Yorkshire & Humber and East Anglia all saw sharp double digit upswings. In contrast new work orders fell in the West Midlands (7%) and North-west (10%).


No comments yet