The latest figures from the Office for National Statistics show that total construction output was up for the third consecutive year, but the rate of growth is slowing
01 / Overview
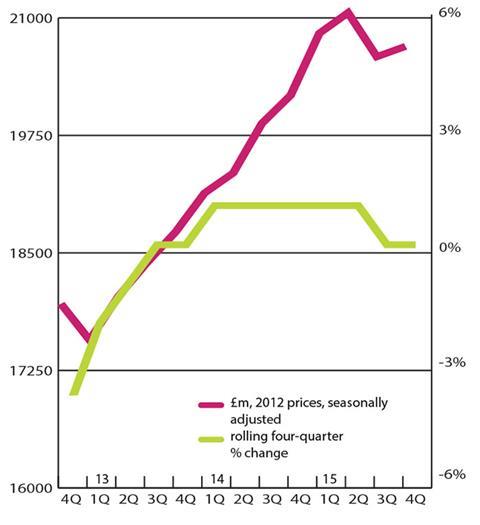
The Office for National Statistics’ (ONS) latest release showed total output in construction hit £130.98bn in 2015 in 2012 prices. It increased for the third consecutive year with a 3% annual rise. Activity in the second half of the year was down 1% on the first, but remained 1% above its level for the same period of 2014.
The second estimate of GDP for the final quarter of 2015 confirmed overall growth at 0.5% on a quarterly basis, broadly in line with the outcome of the previous two quarters, confirming UK expansion is easing to a more moderate pace. The service sector saw strong growth at 0.7% quarter-on-quarter, alongside mild expansion in construction output and a large fall in production (a decline of 2.3%) due to weak oil and gas output. Net trade was also a drag on growth as exports fell marginally while buoyant consumer demand was reflected in a 1.2% rise in imports on the same measures.
Infrastructure output in 2015 reached £17.74bn in 2012 prices, a 30% increase on the previous year and a new high. However, due to the reclassification of a major firm from the support services sector to construction and the counting of its output, largely in the infrastructure sector, from March 2015, there is a statistical discontinuity in the ONS data between February and March 2015, which will not fully unwind until March 2016. The boosted infrastructure output growth substantially last year. In reality it is likely that the growth rate was about half the level in the official data.
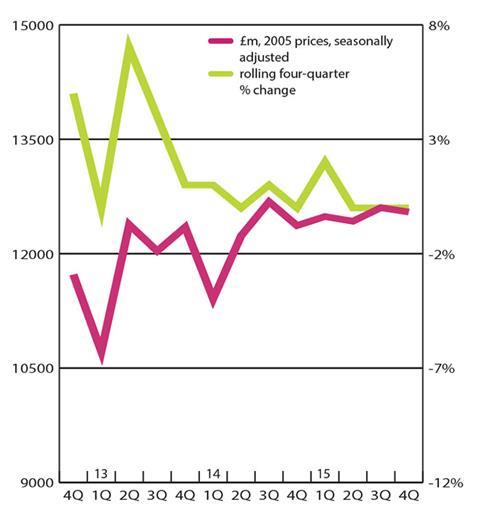
New orders jumped by 50% to £10.86bn in 2005 prices in 2015, a new high, beating the previous peak in 2009 when the main contracts for Crossrail were being placed. The strongest growth in new orders in 2015 was seen in the water and sewerage sub-sector as orders were placed under the Asset Management Programme 6 and contracts let for the Thames Tideway project. New orders for the electricity and roads sub-sectors also grew strongly, but declined for harbours and gas, communications, and air. The industrial sector was next in line with annual output growth of 10%. At £4.33bn, activity has risen for the second successive year, reaching its highest level since 2008, but still well off its average level for the decade preceding 2010.
Private housing activity in the UK rose for its third successive year, up 8% to £23.75bn in 2012 prices. Activity in the final three months of the year reached its highest total since the first quarter of 2007.
In contrast, public housing experienced the sharpest decline, as activity fell 14% year-on-year to £4.89bn. However, this was from the previous year’s record high and activity as a whole remains well above its long-term average level. The sector is expected to experience further falls in the near term as new orders in 2015 tumbled to their lowest level on record (2005 prices).
Output in the public non-residential sector fell for its fifth successive year in 2015, with a 2% reduction to £9.38bn. Activity should get a boost towards the latter part of the forecast period as work starts on major schemes for University College London and Glasgow university.
At £23.77bn, commercial activity had edged downwards by 1% in 2015. The current level of activity remains notably below its 2008 peak despite an economic environment which has been quite accommodative to the consumer with low interest rates, inflation and increasing real wage.
While the offices market in London has been particularly buoyant it may well have passed its peak development cycle. Output towards 2018 is likely to be weaker as the broader economic environment becomes less accommodative to the consumer, leading to a reduction in demand for retail facilities.
Total new work orders increased by 3% to £50bn in 2015, after posting their fourth successive annual increase. However, all of the upside came from the infrastructure sector, as the remaining new work orders fell over the same period.
In contrast, the public housing and public non-residential sectors saw the sharpest declines; the former fell to its lowest level on record and the latter to its lowest total since 1980.
02 / New work output
03 / R&M output
04 / New work orders
05 / 2016-18 Forecast
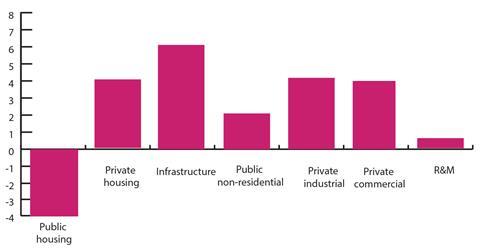
While our forecasts do remain positive for the majority of new work sectors, the general outlook is slightly less positive than it was three months ago. This is on the back of a decline in expectations for general economic activity over the forecast period. Despite these factors, infrastructure activity is set for the fastest annual average expansion, followed by the industrial and commercial sectors.
Public housing is the only new work sector predicted to decline over the same period.
06 / Regional new work output
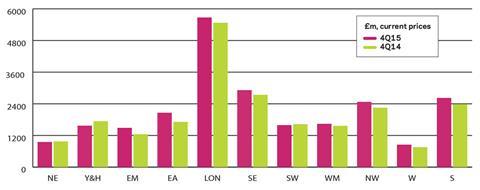
New work output in the final quarter of 2015 rose in eight out of 11 regions and devolved nations when compared to its level for the same period of 2014. The East Midlands and east of England experienced the strongest growth.
07 / Regional R&M output
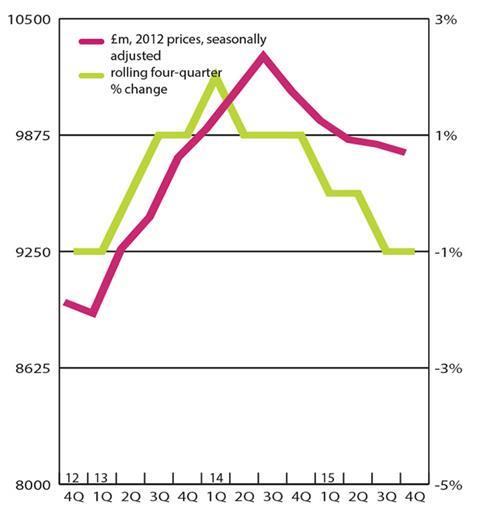
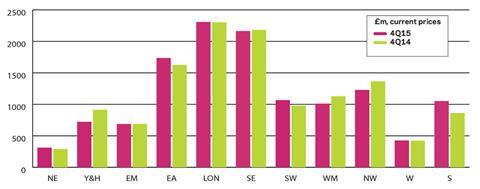
Activity for the repair and maintenance sector (R&M) only increased in six out of 11 regions and devolved nations on the same measures. Of those, Scotland saw the largest expansion in percentage terms.
08 / Regional new work orders
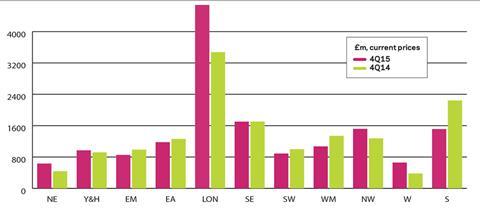
Only five out of 11 regions and devolved nations experienced an increase to new work orders in the final three months of 2015 when compared to the same period a year earlier. Wales and the North-east experienced the sharpest increases on the same measure.




No comments yet