


What can cost, time and functional metrics tell you about delivering a capital programme in the aviation sector? David Crewe of Turner & Townsend explains why it makes sense to reach beyond the traditional measures of development efficiency
01 / Introduction
The global aviation sector is a complex one to analyse but one thing’s always certain, it changes at an incredibly fast pace and there’s no sign of any deceleration. New partnerships in airport operation and ownership models, branded global airline alliances, intense competition between hub airports and shifting travel patterns and destinations mean that the global aviation map is closer to revolution than evolution.
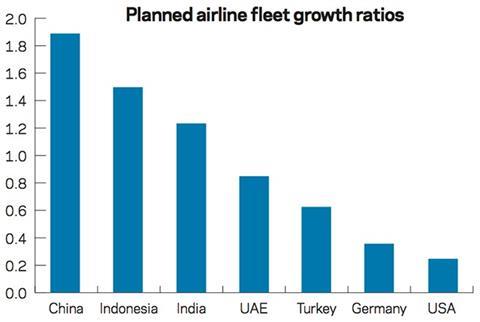
The information available on the airline fleet growth (see chart, right) tells a story in itself.
The fastest growing fleets are in China, Southeast Asia, India and this is reflected in the planned infrastructure boom in the regions. Growth in the Middle East is being driven primarily by the geographical benefit of being a hub for transfer passengers to these emerging markets as well as becoming a recognised business and tourist destination.
Even this picture is complex though, as much of the fleet growth in Asia is driven by short-haul low-cost travel, the Gulf carriers are buying literally for the long haul and the US is replacing an ageing fleet partly driven by growing environmental pressures.
Whilst there is growth in Europe the pace is slower and there are significant existing constraints to growth, through runway capacity in the UK, for example. Business communities are desperate for better resilience while pressure groups are lobbying western governments hard to keep their promised targets on carbon output reduction and environmental pollution.
So how does all this translate into the development of assets? Well the airport development market is massive - with US$400bn of planned or in-development airport projects globally.
Most people in the UK, on the back of the high-profile Davies Commission, are aware of the issues surrounding development at Heathrow and Gatwick. But until we get some desperately needed ground capacity it’s all about improving resilience and the passenger experience.
The same applies, to a degree, across developed Western Europe. In the US, which is still a huge market, there are major investments planned in improving existing facilities with some new terminals planned, but no new “greenfield” developments.
In the Middle East it’s all about competition to have the most attractive hub airport in the region. In India, the driver is generally capacity based and likewise in Southeast Asia and China.
In Brazil they are still building capacity ahead of the 2016 Olympic Games, so the schedule is a big driver, which they seem to be struggling with.
Most of Australia’s main airports are at capacity and anticipate major infrastructure expansions. Perth is experiencing a reduction in domestic passengers due to the downturn in the mining sector, however international demand continues to expand with Australian passenger numbers doubling since 2000 across the country. While the majority of investments will be to expand and improve existing terminals, federal government approval has been given for a second Sydney airport.
02 / Key issues
So it’s not altogether surprising that the development outcomes for airports against traditional cost per-metre-squared of space provided often bare no correlation, as can be seen from a random sample of international data drawn from 100 recently completed projects and programmes.
The reasons for this are again complex and multiple. To make sense of them it’s essential to categorise and catalogue attributes under the following general headings:
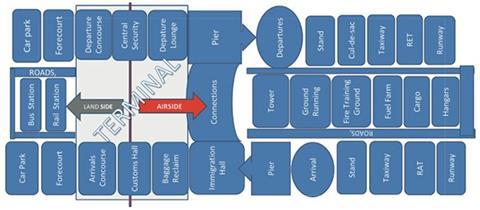
Facility type and asset class - anyone travelling through an airport touches a huge range of facilities: from check-in through security, retail and catering, transport to the concourse, gates, air bridges, and then after landing there are further facilities before the onward passenger interchange. There are also many essential assets that passengers hopefully don’t encounter, such as air traffic control, baggage handling and transfer systems, airfield operations stand facilities, runway maintenance, fuel farms and control towers. The diagram on the far right illustrates the extent of these facilities. Most airport developments apart from the few mega “greenfield” hubs involve a combination of these asset classes at any one time, which makes data related to the scale of development as a whole almost meaningless for comparison purposes. The airport transport interchanges, particularly those with sub-surface rail connections, have a significant commercial and schedule impact which can significantly skew outcome data. So for comparison purposes it’s best to extract these elements and compare them as an asset class.
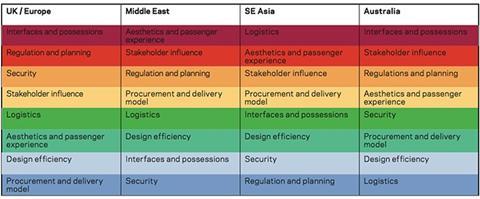
It’s also important to appreciate the local factors which influence cost and time outcomes as well as those attributable to the sector and the facility. The degree of influence shifts from region to region which is shown in the heat map table (below). The key generic influencers, though, are as follows:
Aesthetics and the passenger experience - everything from the journey to and from the airport and the transport interfaces, the image and design quality of the internal and external environment, the quality of retail and catering facilities, passenger movement systems to reduce times to and from gates, efficient and effective baggage handling systems and the sophistication of the airport communication
and information systems.
Security - both in relation to the development process and also in how keeping operatives and passengers safe translates to the built environment. The complexities of securing access for operatives depend on whether these are on the airside” or “landside” part of the airport and can impact both time and cost.
Interfaces and possessions - even on greenfield hub developments interfaces can be complex and asset types need careful management. On live sites “possessions” (access for construction) need to be arranged and managed and both the client and supply chain need to work collaboratively to avoid significant unexpected disruption.
Client maturity in relation to stakeholder influence - there are too many stakeholders to list here on a typical development, but the airlines are obviously a major influencing customer and will have significantly variable requirements between the point-to-point low-cost carriers and long-haul operators. The maturity of the client body in dealing with these complex and often competing briefs is a big factor influencing cost and time outcomes.
Design efficiency - the BIM “train” is on its way but not yet anything like comprehensively implemented in all / any regions, although co-ordination, clashes, abortive design and construction is still a significant issue - there are plenty of examples of the impact of poor co-ordination in the sector. There can also be a significant amount of “overdesign” given the relatively short lifespans of facilities and also the pressures on development teams to meet airline schedule commitments.
Procurement and delivery model - the most effective procurement and delivery models are not always compatible with local procurement practice and plenty of waste can be seen from organisations who try to throw all the inherent risks in developing an airport “over the fence” to a supply chain that’s not geared up to cope.
Logistics - the complexities of securing and managing the provision of labour materials, plant specialist aviation specific equipment, air bridges and baggage handling systems sometimes in competition with major local infrastructure programmes. Logistics solutions may result in significant road rail and port improvements which drive up the overhead burden while poor logistics planning can be highly disruptive.
So how do these factors vary across global regions? This chart shows a review on recently completed aviation projects, which analysed the impact of these issues and ranked them in order of significance. Red equals very significant and blue is least significant.
03 / Variable ‘drivers’
So it’s clear that the big influencers of cost and time outcomes vary from region to region, in Southeast Asia logistics supply organisation and management in densely populated areas is a major factor, whereas in Australia there’s usually plenty of space with good infrastructure in place to accommodate supply chains.
Delivery models in mature markets are less significant than in, for example, the Middle East and Southeast Asia - where inappropriate risk transfer can induce unpredictable results.
These factors are important to appreciate and apply when using benchmarks to compare outcomes and to model new aviation programmes.
04 / Aviation metrics
Given all the complexities in the sector, traditional cost/m2 metrics are not always the best way to assess development cost, particularly when used in isolation. It’s important to consider a “basket” of metrics and to fully appreciate the drivers behind them.
We have illustrated this through choosing a typical selection of terminal facilities in different global regions. The terminals are a mixture of new facilities, extensions to existing, some connecting to subterranean passenger interchanges and others with only surface travel connections. They are all major regional hubs which means we aren’t comparing some of the low-cost budget terminals with long-haul facilities.
The projects in Africa and the Middle East were new terminals constructed effectively in a “landside” (non-operational) environment; the projects in Europe and UK were new terminals or concourses in an operational environment; while the Australian projects were complex extensions to existing terminal facilities.
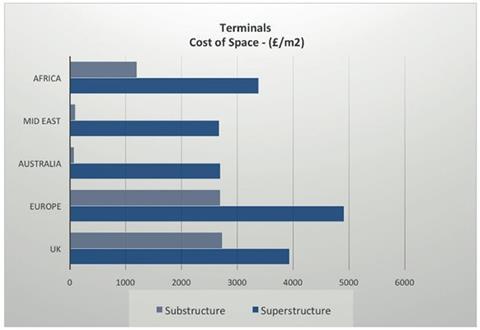
The traditional metric of cost per m2 of gross internal floor area is highly volatile when both substructures and superstructures are combined. The range of costs have a reasonable correlation when considering just the superstructure, but this doesn’t give the whole story, as illustrated in the diagrams opposite.
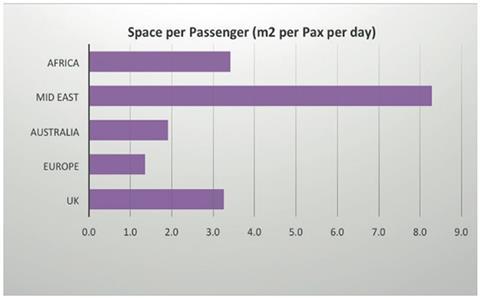
The spacial metrics were also analysed, simply defined as the space provided to accommodate the designed passenger throughput. In the case of extended facilities we’ve looked at the additional passenger capacity generated as a result of the development. Of the facilities chosen for review it’s clear that some are far more generous than others in terms of space provided. Obviously this will have an impact on the passenger experience but also might represent some inefficiencies in the design. In the Middle East for example these are sometimes as a result of adherence to an iconic footprint - to create that “wow” factor that they are all competing for.
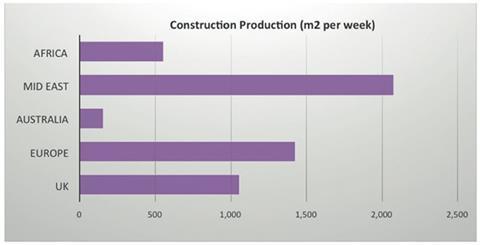
Construction production we have measured simply as the rate of terminal area completed on a weekly average. It’s a completely different scenario when working on extending a live terminal facility as with the two projects selected in Australia, as opposed to the new terminals on unrestricted sites in the Middle East region.
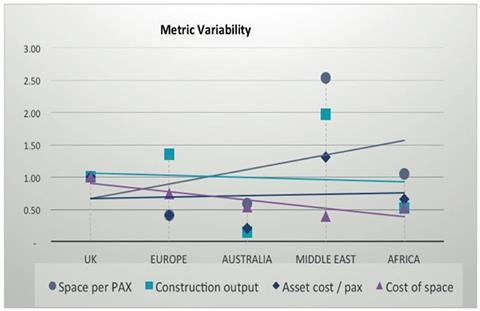
The combination of the cost and space metrics can then be used to assess the development unit cost per designed passenger throughput. This has been assessed for extended terminals based on the additional capacity generated by the development. A very different picture of efficiency emerges using this metric.
05 / Conclusion
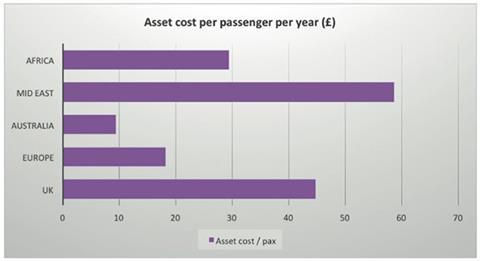
What’s most interesting is to see how this all translates into the capital cost spent to create that additional passenger capacity. Of course, this is just for the terminal facilities and doesn’t take account of the associated piers, pavement and runway works, as well as all the aforementioned passenger interchange issues.
We should also consider the revenue generated by these facilities aside from the landing charges through retail, catering and parking, but provided the optimum flows and circulation of passengers can be accommodated in refurbished or extended facilities, there’s no reason why “sweated assets” should deliver diminished returns. There is, however, a detrimental revenue impact during construction which should not be ignored.
But it’s clear that despite being comparatively inefficient in terms of their time on site, the extensions developed in Australia represent excellent value for money in terms of the cost per passenger. The construction cost was perhaps lower than expected compared to new facilities as they were able to use existing supply infrastructure and some of the development had been previously safeguarded. They might have been painfully difficult to develop and how enjoyable their passenger’s experience is moving through this terminal is open to debate. The operators no doubt will measure this and compare with others but it’s clear that their approach has delivered an effective commercial outcome.
We have shown that it is possible to compare cost and time performance on complex aviation projects but to get true measures of efficiency you have to consider the functional provision. After all it is everyday passengers who are driving the need for new facilities.


No comments yet