


Brexit looms ever larger, with no answers as yet, while output continues a gradual decline and firms struggle to turn rising input cost pressures into higher market selling prices
01 / Executive summary
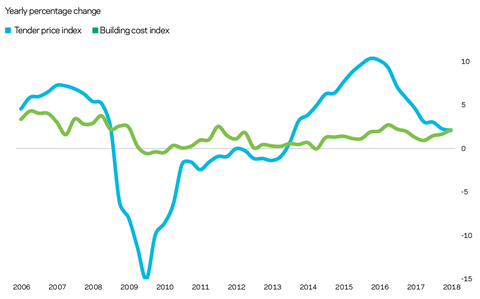
Tender price index ▲
Tender prices increased by 2.1% over the year during Q1 2018. Inflationary pressures are lingering despite a deceleration in overall output.
Building cost index ▲
A composite measure of building input costs maintained an elevated trend of 2.1% in Q1 2018. Elevated input cost trends are keeping commercial pressures on the supply chain.
Consumer prices index ▲
The annual rate of change dropped to 2.5% in March. The yearly rate of change is the lowest in a year but remains above its target of 2%.
02 / Trends and forecasts
With less than 11 months until Brexit, Eurostat – the European Union’s statistical organisation – is now publishing EU economic data without including the UK. While this is a paper exercise, construction businesses will have to grapple with the practicalities of Brexit this year, in whatever shape the withdrawal takes. It should be remembered that the transition period, while supposed to offer certainty to businesses, is conditional on agreement of a final withdrawal treaty. No deal is still seemingly an option.
The structural economics of construction firms are influenced by most forms of any Brexit deal. Sourcing strategies for construction labour, materials and components are likely to require adjustment, as many projects being tendered presently or coming up for tender will inevitably have construction programmes extending beyond April 2019. The further beyond that date that any construction programme extends, the larger the impact from a diminishing transition period would be – and if there is no Brexit deal, a full suite of impacts would occur immediately.
In any event, distribution economics for the supply chain very probably become more complex where there are links to EU-sourced materials and components. Are major port handling facilities on both sides of the English Channel prepared for the likely disruption? Highlighting the uncertainty, planned investment in port facilities in the Netherlands has been stalled because of the progress of Brexit negotiations. Some form of disruption is inevitable.
How will the construction supply chain deal with these unknowns? Higher risk premiums are likely as the supply chain assesses allowances and inclusions to bids. The predicament is a good test of contractors’ corporate governance policies and procedures, which were firmed up a consequence of the last downturn. Equally, an increase in the number of exclusions to a commercial offer is possible, with implications for compliant tenders. Will construction programmes be extended to allow for conceivable disruptions to imports and expected longer lead times for port handling –
not to mention cost impacts associated with extended preliminaries?
Nonetheless, businesses will have to plan and resolve commercial decisions without trading clarity and its associated legal certainty for the time being. A simpler approach presently might be to assume the status quo and invoke changes in law clauses within forms of contract during the post-contract period – deferring substantial commercial discussions and implications to a later date.
Looking at the current picture, the UK construction industry is now in the second phase of its expansion since 2014. As it enters the late stages of this cycle it is not scale but direction of travel that is the key issue. Although the industry is decelerating, two broad narrative interpretations can be taken. The first is that respectable overall work volumes are still evident and reversion to the mean is occurring. The second is that something more portentous is on the horizon. The latter view has merit because the 2000s saw a two-phase industry cycle before the financial sector-led events of 2007-08 caught up with the global economy and reverberated across the world.
Because of the deceleration in activity, uncertainties loom larger with respect to where new work comes from. In a busy market there is a blurring of the lines between construction sectors, as all feel the benefits. But the distinction between peripheral and core sectors becomes more evident in a slowing marketplace. Housebuilding was the core industry sector for the last four years, almost doubling its output and propelling the construction industry to record output. Peripheral sectors contributed to this record output but they have begun to weaken and fade more quickly than housebuilding over recent quarters. Some firms have started to consider or begin restructuring as preparation for a slower period in their key market sectors. It is likely that others will follow in due course.
The economic backdrop is increasingly lacklustre, posting just 0.1% growth in the first quarter of 2018. This is the lowest rate of change since the end of 2012 and sits in stark contrast to other comparable economies in the eurozone or the G7. The manufacturing sector slowed substantially after a strong 2017. Slower EU export growth and capacity constraints have contributed to a weaker sector here. Consumer spending is being tightened very quickly, and changes here have significant effects on the UK’s service sector, which makes up 80% of the economy.
Consumer credit tumbled in March as well, recording the lowest value since the final quarters of 2012. Some of this is attributable to tightened regulation on bank lending to consumers. Part is related to greater fragility in consumer confidence stemming from economic and political uncertainty. This combination of key and supplementary economic indicators makes the prospects of a slower road ahead much more likely. In the meantime, sterling took a hit as the likelihood of a bank rate rise decreases, and as a result of the weaker economic data and outlook.
03 / Activity indicators
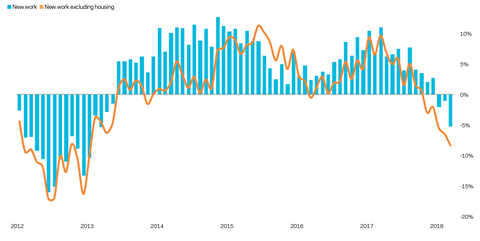
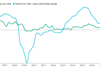
All work construction output fell by 5% in March versus the same month in 2017. This marks the continuation of a pattern whereby the yearly rate of change each month has followed a falling trend, since early 2017. A similarly high negative rate of change in construction output data has not been found since March 2013. In spite of this metric, which compares to a year earlier, there are still respectable levels of output overall. But the prevailing trends indicate that lower output is the future direction over the near- to medium-term.
On the flip side, and if seeking a positive interpretation of the data, recent revisions to output statistics confirm that 2017 was much more resilient and buoyant than the initial data releases indicated. Private housing was again one of the construction sectors – often the leading sector – posting the highest output change over the year.
However, new work levels,
excluding housing, reveal a starker trend. As the housing sector has propelled the industry’s expansion since 2013, it is worth looking beyond
this sector’s rate of growth to understand the story of the rest of the industry. New work output without housing tumbled 8% in March when compared with 12 months earlier. This is a significant fall for this metric, which began its negative run in November 2017.
New orders for main contractors also slipped by 1.3% in Q4 2017 versus Q4 2016. Quarter-on-quarter movement from Q3 to Q4 2017 posted a sizeable fall of 25%. However, rates of change for new orders at quarterly and yearly measures tend to be volatile, quite often alternating between positive and negative readings, so this data
in itself is not necessarily always a direct indicator of next phases. Clearly, more frequent readings where negative values are recorded will indicate a trend as to where output will end up.
All construction sectors saw declines in new orders between Q3 and Q4 2017, with a broad range between -1.7% for private commercial and -50.5% for infrastructure. The sector did though record a 16.4% increase in new orders in Q4 2017 when compared with Q4 2016.
Recent sentiment surveys indicate some weakening in infrastructure’s prospects. Headline sentiment surveys for the construction industry more generally continue to indicate confidence. Respectable underlying momentum in present workload offers the support to these aggregate views, typically mirroring those of the wider UK economy.
Although a broader trend of lower overall output is clear, sentiment is holding up because of capacity constraints across the industry. These constraints are a direct consequence of prevailing workload and tight supply-side factors. Measures of firms working at or near to capacity remain well above long-run averages. Some softening in capacity indicators is evident but there is a significant turnaround necessary to revert back to a long-run average measure of capacity utilisation.
Many UK regions report still busy conditions – both published sentiment surveys and anecdotally. All of this is despite a clearer view on the path for the UK economy and increasingly mixed signals across the construction’s sector breakdown.
Most trade contractors view 2018 as a sound year for work. Looking back, they indicated a similar view for 2017 throughout last year, and this is borne out by output data that was revised upwards notably in ONS data releases. More of the industry is increasingly discussing the mixed picture further out. This is plausible given that main contractors have expressed the same concerns for longer and that trade contractors are later in the procurement process, and therefore feel the effects later.
A / Aecom indices
04 / Building costs and prices
Tender prices rose by 2.1% over the year to Q1 2018, reflecting lingering inflationary pressures. Materials and labour cost increases were experienced by a majority of contractors across the industry during the final quarter of 2017 and the first quarter of 2018. However, market selling prices were unable to rise above the input cost increases experienced. An inability to pass through all the input cost pressures maintains commercial tension for main and trade contractors. Nevertheless, with a combination of capacity constraints and present workload, there is still some transfer into output prices given the recorded increase of over 2% in the year.
Elevated input costs offer little respite to the commercial pressures in the supply chain. Expectations for much of the remainder of 2018 are that input costs will remain at the higher level or increase further. Views on output prices are more subdued now because of the patchier medium-term outlook and increased market competition. Inevitably, this combination leads to heightened pressure on already thin industry margins, particularly those of main contractors.
Further variations in sterling foreign exchange rates would support higher input cost trends for imported construction materials and components. Future risks that could propel input costs higher are further weakening of sterling, perhaps as a result of poorer economic data; an unwinding of expectations about bank rate rises; Brexit negotiations; or a combination of all three.
Concerns around industry labour resources remain, although generally they have eased a little over Q1 2018. However, there are still elevated constraints for individual key site trades: bricklayers, joiners and other trades closely linked with housebuilding, for instance. Higher demand for these trades and tighter supply has helped to maintain above average wage growth for these trades. Mechanical and electrical disciplines experienced even higher rates of yearly wage growth, which again is reflective of the combination between demand and supply for these skilled trades.
Aggregate measures for trades wages indicate flat or marginal increases over the past year. But more recent changes indicate a slip into negative territory at a headline, aggregated level. Some of this recent change arises from adverse weather conditions in Q1 reducing available working time. In spite of different trends among site disciplines, the underlying trend is towards softer wage growth in response to weakening output data. Construction wage growth – both real and nominal measures – is still linked directly with construction output growth, broadly speaking. This stands in contrast to real wage growth in the whole UK economy, which is no longer following the established pattern that when the UK’s gross domestic product increases, wages increase too.
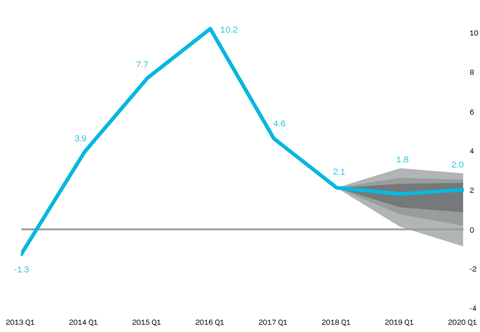
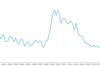
Aecom’s baseline forecasts for tender price inflation are 1.8% from Q1 2018 to Q1 2019 and 2.0% from Q1 2019 to Q1 2020. A combination of existing momentum in workload, expected activity, capacity constraints and elevated input costs are the primary drivers of the inflation forecasts. Marginal downside risk is expected to prices over the coming forecast period. A more pronounced level of downside risk also weighs on the outlook through to Q1 2020, stemming from the cyclical and political events that are expected to combine and influence the UK’s economic and construction prospects.
The price forecasts are based on key assumptions – construction output will continue a downward trend towards a long-run mean; future work is secured for contractors but with more flexibility on terms and conditions rather than significant price reductions; UK economic conditions – both cyclical and Brexit-related – are a source of greater turbulence; government capital expenditure does not increase; and sterling sees on-going fluctuations and remains lower for longer.
B / UK construction output yearly change
C / Tender price inflation (yearly run rate and forecasts)
Percentage change at Q1 on a year earlier (12-month periods). Baseline forecast 50%/70%/90% probability distributions shown

No comments yet