


What happens when an engineer decides to build his new family home? Will Jones reports on Gifford director Richard Quincey's house, built two years ago, including an assessment of the performence of the solar systems he installed
- Family house built in 2005 in Devon aiming to be near-zero energy
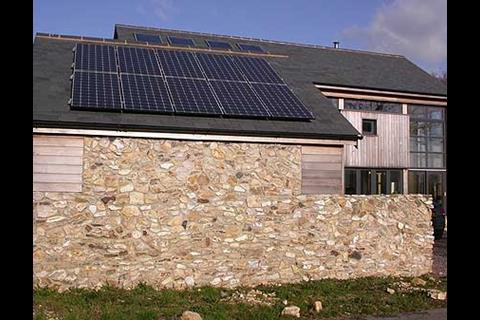
- Amost air-tight building envelope clad in timber and local stone
- Carbon footprint of house expected to be between 13-15gCO2/m2
- Data on energy consumption and PV system installed
When Richard Quincey, technical director at Gifford, decided to build his family a new home it had to be a sustainable one. Finding a south-facing plot in a Devon village, he engaged the services of an architect whom he knew he’d be able to work with. “I had some very definite views about how things should be designed,” says Quincey. And the pair began designing a near-zero energy home.
The home features a raft of sustainable measures. A panelised deep-stud timber frame, super insulation and timber composite argon-filled low-e windows create an almost air-tight building envelope that is finished in zero maintenance external timber cladding and local stone.
Warming up nicely
Low energy positive input ventilation and heat recovery and passive solar design measures, including a winter garden and double-height spaces make for a pleasant internal environment. This can be warmed further by a wood-burning stove or a small, highly efficient electric boiler, powered by photovoltaic energy.Two active solar systems – an Ecosun and a Sunwarm Plus from Nuaire – provide boosted input ventilation and whole house ventilation with heat recovery and hot water, respectively. Low energy and low water use appliances and sanitary ware abound, while the lighting is all low energy and includes some LEDs.
The project was designed in the summer of 2004 and built in 2005. The house has now been standing for nearly two years. “When you have your energy strategy in place before you start building, the design possibilities really open up,” says Quincey. “Low energy and renewable energy systems replaced traditional systems, rather than being add-ons, making them truly viable as opposed to lifestyle choices.”
Temperature tally
Since he completed the house, Quincey, like the committed engineer that he is, has been monitoring its performance. “In overall terms the house is performing very well,” he says. The insulation measures and airtight design have produced a good radiant temperature with no draughts or cold spots. The internal temperature fluctuates only minimally, whether it’s hot or cold outside. This is helped by the winter garden, which provides winter thermal and summer over-heating protection.Measuring the house’s total carbon output against similarly sized properties running on gas and oil, the results are excellent. While a 195 m2 gas-powered house produces around 11.8 tons CO2 per year and an oil-fuelled property, 14.7 tons CO2 per year, Quincey’s home of the same size produces just 1.5 tons CO2 per year. The total anticipated carbon footprint for the house is between 12.9 and 15.7 kgCO2/m2 including lights, appliances and cooking.


Photovoltaic monitoring of Richard Quincey’s house
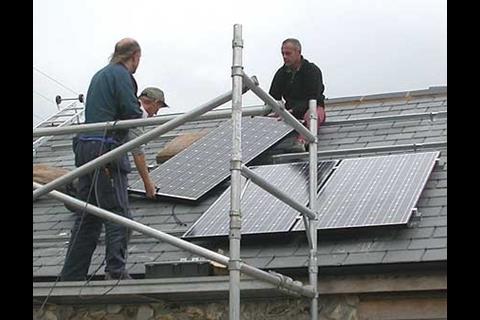
In October 2006 the house had a 2.1kWp PV grid connected array installed taking advantage of the LCBP grant scheme (when the 50% grant was available). The installation comprised of:
* 10 Sanyo HIP 210 NHE1 PV panels (mono-crystalline / amorphous hybrid) (High efficiency cell (18.7%), 16.8% module)
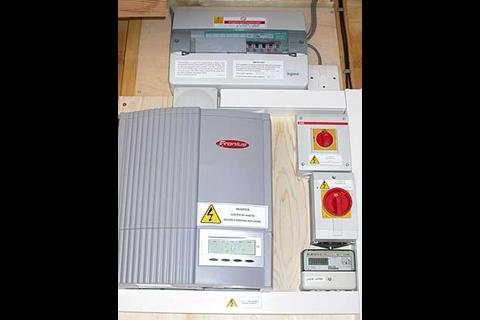
* 1 Fronius IG 20 inverter
* Gross generation and export metering
The data provided by a PV specialist stated an average annual output 1960 kwh for the system. This specialist used the PVSOL software to calculate the system performance for the house. The software uses a number of assumptions, including the amount of energy exported to grid being 650 kwh, giving an approx 77% utilisation of energy on site.
For the first four months, albeit during winter, the system output was monitored to determine the amount of energy utilised on site. This was about 60%, not as good as the PVSOL assumption and only likely to get worse as electricity production increased as the weather got brighter.
Given excellent day lighting and minimal electricity use during peak production hours, Quincey looked at ways to maximise on site utilisation. Appliances like washing machines and dishwashers were operated during peak hours but although the double sunwarm plus system was used to generate hot water, it was clear that winter electrical loads were dominated by cooking and hot water top up.
As a result of calculations at the beginning of February 2007 a Cookermiser unit was fitted and adjusted to monitor the PV output and switch the PV energy (at about 400w) into a bespoke electrical immersion heater (750w) fitted in the top third of the solar hot water cylinder.
Monitoring of the exported energy for the next six months indicated a significant improvement: the amount of energy utilised on site had increased to 82%. Now, monitoring the system for a full 12 months has revealed the unforeseen dilemma of the school holidays. Although the measured annual production is 2060 kwhrs (5% above the manufacturer’s estimate) in August, one of the best PV electricity producing months, there is a period of two to three weeks of virtually zero on site demand. This has the net result of reducing the annual site utilization to approx 73%.
The monitoring suggests the annual yield figures that PV suppliers provide are pretty good; while manufacturers’ on site utilisation figures are optimistic, especially when PVs are likely to be installed on low-e houses with low daytime electrical base loads.
From experience with this house, it seems reasonable to assume 60% utilisation without a hot water dump or about 75% with a hot water dump.


No comments yet